手把手教你使用zabbix监控nginx
zabbix监控nginx,多亏了容哥(杨容)的帮忙,为了感谢容哥的帮助,写了这篇文章。
环境介绍:
服务器系统版本:CentOSrelease 6.6 (Final)
内核版本:Linux hk_nginx2.6.32-504.3.3.el6.x86_64
ZabbixServer版本:Zabbix server v2.2.2
ZabbixAgent 版本:Zabbix agent v2.2.2
Nginxweb 版本:nginx version: nginx/1.5.8
在zabbix agentd客户端上,查看nginx是否加载了--with-http_stub_status_module。因为zabbix监控nginx是根据nginx的Stub Status模块,抓取Status模块所提供的数据。假如以前没开启,现在想启用StubStatus 模块,在编译nginx 的时候要加上参数 --with-http_stub_status_module,执行./configure && make就可以了,不用make install。不过,一般情况下都是安装了的。
1.在nginx的配置文件中,添加status配置。
location/nginx-status {stub_status on;access_log  off;allow 127.0.0.1;allow 192.168.1.10;  #(zabbix服务器的IP地址,一般是内网地址)deny all;
}
2.访问设置好的nginx-status链接,如图所示:

3.nginx Status 详细说明:
Activeconnections:对后端发起的活动连接数;
server accepts 2349542:nginx 总共处理了2349542个连接;
handled:成功创建了64603417次握手;
requests:总共处理了8798670请求。
Reading:nginx读取客户端的header数;
Writing: nginx 返回给客户端的header数;
Waiting: nginx 请求处理完成,正在等待下一请求指令的连接。
4.在agentd上编写监控nginx的脚本,并且设置属主和属组为zabbix,赋予执行权限。
cd /usr/local/zabbix/scripts
cat nginx_status.sh
#!/bin/bash
# Script to fetch nginx statuses for tribily monitoring systems
# Author: krish@toonheart.com
# License: GPLv2
# Set Variables
BKUP_DATE=`/bin/date +%Y%m%d`
LOG="/data/log/zabbix/webstatus.log"
HOST=127.0.0.1
PORT="80"# Functions to return nginx stats
function active {/usr/bin/curl "http://$HOST:$PORT/nginx-status" 2>/dev/null| grep 'Active' | awk '{print $NF}'}
function reading {/usr/bin/curl "http://$HOST:$PORT/nginx-status" 2>/dev/null| grep 'Reading' | awk '{print $2}'}
function writing {/usr/bin/curl "http://$HOST:$PORT/nginx-status" 2>/dev/null| grep 'Writing' | awk '{print $4}'}
function waiting {/usr/bin/curl "http://$HOST:$PORT/nginx-status" 2>/dev/null| grep 'Waiting' | awk '{print $6}'}
function accepts {/usr/bin/curl "http://$HOST:$PORT/nginx-status" 2>/dev/null| awk NR==3 | awk '{print $1}'}
function handled {/usr/bin/curl "http://$HOST:$PORT/nginx-status" 2>/dev/null| awk NR==3 | awk '{print $2}'}
function requests {/usr/bin/curl "http://$HOST:$PORT/nginx-status" 2>/dev/null| awk NR==3 | awk '{print $3}'}
# Run the requested function
$1
chmod o+x nginx_status.sh
chown zabbix.zabbix nginx_status.sh
ll
total 4
-rwxr-xr-x 1 zabbix zabbix 1273 May 13 17:42 nginx_status.sh
5.修改nginx服务器上zabbix客户端的zabbix_agentd.conf配置文件,然后重启zabbix agentd客户端。
cd /usr/local/zabbix/etc
grep -v "^[#;]" zabbix_agentd.conf | grep -v "^$"
LogFile=/tmp/zabbix_agentd.log
Server=192.168.1.10        #zabbix server端的IP地址
ServerActive=192.168.1.10  #zabbix server端的IP地址
Hostname=192.168.1.5       #本地的IP地址
UnsafeUserParameters=1
##下面的是新添加进去的
UserParameter=nginx.accepts,/usr/local/zabbix/scripts/nginx_status.sh accepts
UserParameter=nginx.handled,/usr/local/zabbix/scripts/nginx_status.sh handled
UserParameter=nginx.requests,/usr/local/zabbix/scripts/nginx_status.sh requests
UserParameter=nginx.connections.active,/usr/local/zabbix/scripts/nginx_status.sh active
UserParameter=nginx.connections.reading,/usr/local/zabbix/scripts/nginx_status.sh reading
UserParameter=nginx.connections.writing,/usr/local/zabbix/scripts/nginx_status.sh writing
UserParameter=nginx.connections.waiting,/usr/local/zabbix/scripts/nginx_status.sh waiting
6.在zabbix server 端进行zabbix_get测试,取到数据了,说明没问题。
/usr/local/zabbix/bin/zabbix_get -s 192.168.1.5 -p 10050 -k "nginx.connections.active"
11
/usr/local/zabbix/bin/zabbix_get -s 192.168.1.5 -p 10050 -k "nginx.connections.waiting"
10
/usr/local/zabbix/bin/zabbix_get -s 192.168.1.5 -p 10050 -k "nginx.connections.writing"
1
/usr/local/zabbix/bin/zabbix_get -s 192.168.1.5 -p 10050 -k "nginx.accepts"
2350638
/usr/local/zabbix/bin/zabbix_get -s 192.168.1.5 -p 10050 -k "nginx.requests"
8801086
7.在网上搜到一个zabbix中nginx status的模板,把模板导入zabbix服务器。
- <zabbix_export version="1.0" date="14.03.11" time="08.48">
- <hosts>
- <host name="Nginx Status"><proxy_hostid>0</proxy_hostid> <useip>1</useip> <dns /> <ip>127.0.0.1</ip> <port>10050</port> <status>3</status> <useipmi>0</useipmi> <ipmi_ip>127.0.0.1</ipmi_ip> <ipmi_port>623</ipmi_port> <ipmi_authtype>0</ipmi_authtype> <ipmi_privilege>2</ipmi_privilege> <ipmi_username /> <ipmi_password />
- <groups><group>Freetrade</group> </groups><triggers />
- <items>
- <item type="7" key="nginx.accepts" value_type="3"><description>Nginx Accepts</description> <ipmi_sensor /> <delay>30</delay> <history>365</history> <trends>365</trends> <status>0</status> <data_type>0</data_type> <units /> <multiplier>0</multiplier> <delta>0</delta> <formula>0</formula> <lastlogsize>0</lastlogsize> <logtimefmt /> <delay_flex /> <authtype>0</authtype> <username /> <password /> <publickey /> <privatekey /> <params /> <trapper_hosts>localhost</trapper_hosts> <snmp_community /> <snmp_oid /> <snmp_port>161</snmp_port> <snmpv3_securityname /> <snmpv3_securitylevel>0</snmpv3_securitylevel> <snmpv3_authpassphrase /> <snmpv3_privpassphrase />
- <applications><application>Nginx</application> </applications></item>
- <item type="7" key="nginx.connections.active" value_type="3"><description>Nginx Connections Active</description> <ipmi_sensor /> <delay>30</delay> <history>365</history> <trends>365</trends> <status>0</status> <data_type>0</data_type> <units /> <multiplier>0</multiplier> <delta>0</delta> <formula>0</formula> <lastlogsize>0</lastlogsize> <logtimefmt /> <delay_flex /> <authtype>0</authtype> <username /> <password /> <publickey /> <privatekey /> <params /> <trapper_hosts>localhost</trapper_hosts> <snmp_community /> <snmp_oid /> <snmp_port>161</snmp_port> <snmpv3_securityname /> <snmpv3_securitylevel>0</snmpv3_securitylevel> <snmpv3_authpassphrase /> <snmpv3_privpassphrase />
- <applications><application>Nginx</application> </applications></item>
- <item type="7" key="nginx.connections.reading" value_type="3"><description>Nginx Connections Reading</description> <ipmi_sensor /> <delay>30</delay> <history>365</history> <trends>365</trends> <status>0</status> <data_type>0</data_type> <units /> <multiplier>0</multiplier> <delta>0</delta> <formula>0</formula> <lastlogsize>0</lastlogsize> <logtimefmt /> <delay_flex /> <authtype>0</authtype> <username /> <password /> <publickey /> <privatekey /> <params /> <trapper_hosts>localhost</trapper_hosts> <snmp_community /> <snmp_oid /> <snmp_port>161</snmp_port> <snmpv3_securityname /> <snmpv3_securitylevel>0</snmpv3_securitylevel> <snmpv3_authpassphrase /> <snmpv3_privpassphrase />
- <applications><application>Nginx</application> </applications></item>
- <item type="7" key="nginx.connections.waiting" value_type="3"><description>Nginx Connections Waiting</description> <ipmi_sensor /> <delay>30</delay> <history>365</history> <trends>365</trends> <status>0</status> <data_type>0</data_type> <units /> <multiplier>0</multiplier> <delta>0</delta> <formula>0</formula> <lastlogsize>0</lastlogsize> <logtimefmt /> <delay_flex /> <authtype>0</authtype> <username /> <password /> <publickey /> <privatekey /> <params /> <trapper_hosts>localhost</trapper_hosts> <snmp_community /> <snmp_oid /> <snmp_port>161</snmp_port> <snmpv3_securityname /> <snmpv3_securitylevel>0</snmpv3_securitylevel> <snmpv3_authpassphrase /> <snmpv3_privpassphrase />
- <applications><application>Nginx</application> </applications></item>
- <item type="7" key="nginx.connections.writing" value_type="3"><description>Nginx Connections Writing</description> <ipmi_sensor /> <delay>30</delay> <history>365</history> <trends>365</trends> <status>0</status> <data_type>0</data_type> <units /> <multiplier>0</multiplier> <delta>0</delta> <formula>0</formula> <lastlogsize>0</lastlogsize> <logtimefmt /> <delay_flex /> <authtype>0</authtype> <username /> <password /> <publickey /> <privatekey /> <params /> <trapper_hosts>localhost</trapper_hosts> <snmp_community /> <snmp_oid /> <snmp_port>161</snmp_port> <snmpv3_securityname /> <snmpv3_securitylevel>0</snmpv3_securitylevel> <snmpv3_authpassphrase /> <snmpv3_privpassphrase />
- <applications><application>Nginx</application> </applications></item>
- <item type="7" key="nginx.handled" value_type="3"><description>Nginx Handled</description> <ipmi_sensor /> <delay>30</delay> <history>365</history> <trends>365</trends> <status>0</status> <data_type>0</data_type> <units /> <multiplier>0</multiplier> <delta>0</delta> <formula>0</formula> <lastlogsize>0</lastlogsize> <logtimefmt /> <delay_flex /> <authtype>0</authtype> <username /> <password /> <publickey /> <privatekey /> <params /> <trapper_hosts>localhost</trapper_hosts> <snmp_community /> <snmp_oid /> <snmp_port>161</snmp_port> <snmpv3_securityname /> <snmpv3_securitylevel>0</snmpv3_securitylevel> <snmpv3_authpassphrase /> <snmpv3_privpassphrase />
- <applications><application>Nginx</application> </applications></item>
- <item type="7" key="nginx.requests" value_type="3"><description>Nginx Requests</description> <ipmi_sensor /> <delay>30</delay> <history>365</history> <trends>365</trends> <status>0</status> <data_type>0</data_type> <units /> <multiplier>0</multiplier> <delta>0</delta> <formula>0</formula> <lastlogsize>0</lastlogsize> <logtimefmt /> <delay_flex /> <authtype>0</authtype> <username /> <password /> <publickey /> <privatekey /> <params /> <trapper_hosts>localhost</trapper_hosts> <snmp_community /> <snmp_oid /> <snmp_port>161</snmp_port> <snmpv3_securityname /> <snmpv3_securitylevel>0</snmpv3_securitylevel> <snmpv3_authpassphrase /> <snmpv3_privpassphrase />
- <applications><application>Nginx</application> </applications></item></items><templates />
- <graphs>
- <graph name="Nginx Socket Status" width="900" height="200"><ymin_type>0</ymin_type> <ymax_type>0</ymax_type> <ymin_item_key /> <ymax_item_key /> <show_work_period>1</show_work_period> <show_triggers>1</show_triggers> <graphtype>0</graphtype> <yaxismin>0.0000</yaxismin> <yaxismax>100.0000</yaxismax> <show_legend>0</show_legend> <show_3d>0</show_3d> <percent_left>0.0000</percent_left> <percent_right>0.0000</percent_right>
- <graph_elements>
- <graph_element item="Nginx Status:nginx.accepts"><drawtype>0</drawtype> <sortorder>0</sortorder> <color>00EE00</color> <yaxisside>0</yaxisside> <calc_fnc>2</calc_fnc> <type>0</type> <periods_cnt>5</periods_cnt> </graph_element>
- <graph_element item="Nginx Status:nginx.handled"><drawtype>0</drawtype> <sortorder>0</sortorder> <color>EE0000</color> <yaxisside>0</yaxisside> <calc_fnc>2</calc_fnc> <type>0</type> <periods_cnt>5</periods_cnt> </graph_element>
- <graph_element item="Nginx Status:nginx.requests"><drawtype>0</drawtype> <sortorder>1</sortorder> <color>EEEE00</color> <yaxisside>0</yaxisside> <calc_fnc>2</calc_fnc> <type>0</type> <periods_cnt>5</periods_cnt> </graph_element></graph_elements></graph>
- <graph name="Nginx Clients Status" width="900" height="200"><ymin_type>0</ymin_type> <ymax_type>0</ymax_type> <ymin_item_key /> <ymax_item_key /> <show_work_period>1</show_work_period> <show_triggers>1</show_triggers> <graphtype>0</graphtype> <yaxismin>0.0000</yaxismin> <yaxismax>100.0000</yaxismax> <show_legend>0</show_legend> <show_3d>0</show_3d> <percent_left>0.0000</percent_left> <percent_right>0.0000</percent_right>
- <graph_elements>
- <graph_element item="Nginx Status:nginx.connections.active"><drawtype>0</drawtype> <sortorder>0</sortorder> <color>0000EE</color> <yaxisside>0</yaxisside> <calc_fnc>2</calc_fnc> <type>0</type> <periods_cnt>5</periods_cnt> </graph_element>
- <graph_element item="Nginx Status:nginx.connections.writing"><drawtype>0</drawtype> <sortorder>1</sortorder> <color>EE0000</color> <yaxisside>0</yaxisside> <calc_fnc>2</calc_fnc> <type>0</type> <periods_cnt>5</periods_cnt> </graph_element>
- <graph_element item="Nginx Status:nginx.connections.waiting"><drawtype>0</drawtype> <sortorder>2</sortorder> <color>EEEE00</color> <yaxisside>0</yaxisside> <calc_fnc>2</calc_fnc> <type>0</type> <periods_cnt>5</periods_cnt> </graph_element>
- <graph_element item="Nginx Status:nginx.connections.reading"><drawtype>0</drawtype> <sortorder>3</sortorder> <color>00EE00</color> <yaxisside>0</yaxisside> <calc_fnc>2</calc_fnc> <type>0</type> <periods_cnt>5</periods_cnt> </graph_element></graph_elements></graph></graphs><macros /> </host></hosts><dependencies /> </zabbix_export>
8.登陆到zabbix服务器首页,点击”组态”-“模板”。

点击”汇入”,如图所示

点击“汇入文件“,然后把找到的nginx_status.xml文件,汇入模板。

创建应用集Nginx Server。


把nginx主机连接到模板上去。
 最后,看下是否可以检测到数据,是否可以顺利出图。


到此为止,实验结束。
转载于:https://blog.51cto.com/taokey/1651225
相关文章:

理解多线程设计模式
多线程设计模式:1.Single Threaded Execution Pattern [同一时刻只允许一个线程操作] 比喻:三个挑水的和尚,只能同一时间一个人过桥,不然都掉河里喂鱼了。 总结:在多个线程同时要访问的方法上加上synchronized关键…

Linux内核之旅
内核模块是Linux内核向外部提供的一个插口,其全称为动态可加载内核模块(Loadable Kernel Module,LKM),我们简称为模块。Linux内核之所以提供模块机制,是因为它本身是一个单内核(monolithic kern…
qq腾讯第三方登陆
html页面:<html> <head> <meta charset"utf-8" /> <title>第三方登录</title> <meta property"qc:admins" content"1541324001721762700063671645060454" /> </h…

如何利用 Python 爬取 LOL 高清精美壁纸?
作者 | 阿拉斯加 来源 | 杰哥的IT之旅 一、背景介绍 随着移动端的普及出现了很多的移动 APP,应用软件也随之流行起来。最近看到英雄联盟的手游上线了,感觉还行,PC 端英雄联盟可谓是爆火的游戏,不知道移动端的英雄联盟前途如何&…
生产环境主从数据同步不了?
生产环境主从数据同步不了?经历过程: 一般我们常常在做主从复制的时候,可能是很少遇到到错误,那都是因为,你做主从基本用的是,本地虚拟机做,或者一些测试环境做。但是当我们把主从复制部署…

用 YOLOv5模型识别出表情!
作者 | 闫永强来源 | Datawhale本文利用YOLOV5对手势进行训练识别,并识别显示出对应的emoji,如同下图:本文整体思路如下。提示:本文含完整实践代码,代码较长,建议先看文字部分的实践思路,代码先…
Linux操作系统中内存buffer和cache的区别
我们一开始,先从Free命令说起。 free 命令相对于top 提供了更简洁的查看系统内存使用情况: $ freetotal used free shared buffers cachedMem: 255268 238332 16936 0 85540 126384-/ buffers/cache: 26408 228860Swap: 265000 …
sort cut 命令的常用用法
sort命令介绍:sort是在Linux里非常常用的一个命令,管排序的,集中精力,五分钟搞定sort,现在开始!1 sort的工作原理sort将文件的每一行作为一个单位,相互比较,比较原则是从首字符向后&…

使用 dockerfile 创建镜像
dockerfile 是一个文本格式的配置文件,可以使用 dockerfile 快速创建自定义的镜像。 dockerfile 一般包含4部分信息:基础镜像信息、维护者信息、镜像操作指令、容器启动时执行指令 创建镜像命令:docker build [选项] 路径,会读取指…
wireshark的使用教程--用实践的方式帮助我们理解TCP/IP中的各个协议是如何工作的
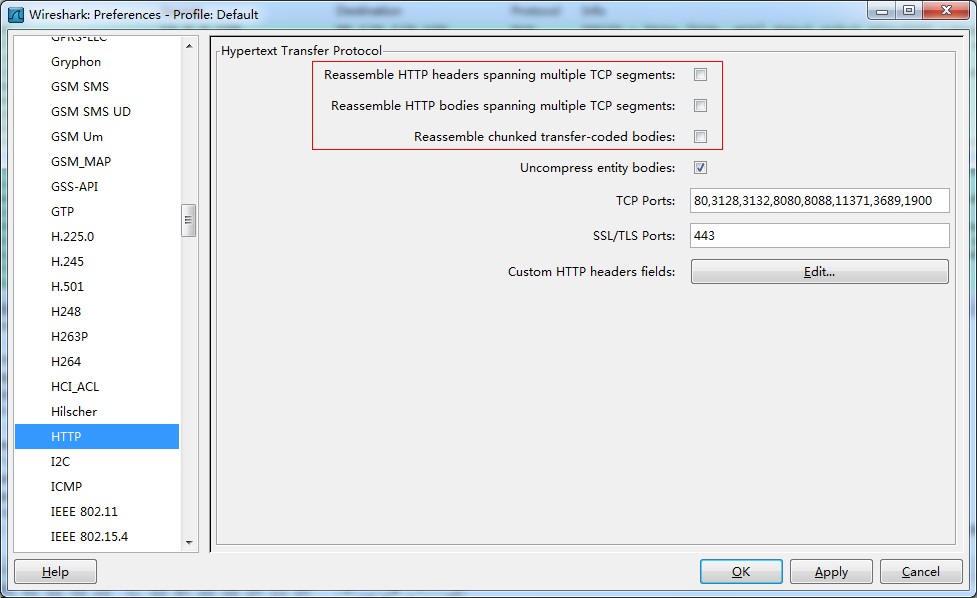
wireshark的使用教程 --用实践的方式帮助我们理解TCP/IP中的各个协议是如何工作的 wireshark是一款抓包软件,比较易用,在平常可以利用它抓包,分析协议或者监控网络,是一个比较好的工具,因为最近在研究这个,…

设计师你们还坐的住吗?2021 PS 进入人工智能 P 图时代
与每年一样,Adobe 的 Max 2021 活动顺利开展。本次活动主要是以产品展示以及其他创新产品。 这个活动最有趣的特点之一是,Adobe 不断将人工智能集成到其产品或是功能中。在过去的几年里,人工智能一直是这家公司不断探索的领域。 与许多其他公…
图像处理之噪声---椒盐,白噪声,高斯噪声三种不同噪声的区别
白噪声是指功率谱密度在整个频域内均匀分布的噪声。 所有频率具有相同能量的随机噪声称为白噪声。白噪声或白杂讯,是一种功率频谱密度为常数的随机信号或随机过程。换句话说,此信号在各个频段上的功率是一样的,由于白光是由各种频率ÿ…

发现一个“佛系记账本”
因为这是一款微信小程序,张小龙大力推崇的“用完即走”完美地适合记账应用。 不用下载、不用安装、不用注册、不用各种授权,只要从微信进入,就能记账,账本只与微信关联。 换手机、换PAD都无所谓,只要登录微信ÿ…
YSLOW法则中,为什么yahoo推荐用GET代替POST?
原文:http://www.cnxct.com/use-get-for-ajax-requests-why/ 背景:上上周五,公司前端工程师培训,提到前端优化的一些技巧,当然不能少了yahoo yslow的优化法则。其中有这么一条“Use GET for AJAX Requests”࿰…

Python 多进程、协程异步抓取英雄联盟皮肤并保存在本地
作者 | 俊欣来源 | 关于数据分析与可视化就在11月7日晚间,《英雄联盟》S11赛季全球总决赛决斗,在冰岛拉开“帷幕”,同时面向全球直播。在经过了5个小时的鏖战,EDG战队最终以3:2战胜来自韩国LCK赛区的DK战队,获得俱乐部…

QT 5.4.1 for Android Ubuntu QtWebView Demo
QT 5.4.1 for Android Ubuntu QtWebView Demo 2015-5-15 目录 一、说明: 二、参考文章: 三、QtWebView Demo在哪里? 四、Qt Creator 3.4.0能打开QtWebView Demo? 五、Qt Creator如何生成AndroidManifest.xml? 一、…
硬改TP-Link WR841N v8刷breed和OpenWrt
找到了以前的路由器,想刷OpenWrt但版本是TP-Link的WR841N v8版,上网查过才知道,是专门面向国内发布的严重缩水版国际版的Flash是4M,内存RAM是32M,国内版是2M/16M,不过论坛上也有人说到手的Flash是4M的。(Op…

Facebook的实时Hadoop系统
原文地址: http://blog.solrex.org/articles/facebook-realtime-hadoop-system.html作者:杨文博Facebook 在今年六月 SIGMOD 2011 上发表了一篇名为“Apache Hadoop Goes Realtime at Facebook”的会议论文 (pdf),介绍了 Facebook 为了打造一…
Ka的回溯编程练习 Part1|整划什么的。。
1 #include<stdio.h>2 int search(int s,int t);3 void op(int k);4 int res[1001]{1},n;5 int main()6 {7 //scanf("%d",&n);8 n10;9 search(n,1); 10 return 0; 11 } 12 int search(int s,int t) //当前数的大小s,个数n 13 …

开发者关心的十个数据库技术问题
作者 | 雷海林 责编 | 田玮靖出品 | 《新程序员》如今,数据库越来越受到业界的广泛关注,许多高校毕业生及资深技术人也逐渐投身于数据库产业。《新程序员002》经过用户、专家调研,收集汇总了十个开发者关心的数据库技术问题,…
使用T-SQL语句操作数据表-更新数据
使用update语句更新表中的数据。也就是修改表中的数据。update语法格式:update <表名> set <列名更新值> [where <更新条件>] 解释:update 是更新数据名, 表明是更新数据set 是必要的, 后面可以紧随多个数据列的…

Category Archives: Linux
原文地址:http://blog.solrex.org/articles/solrex-linux-cheatsheet.html Cheatsheet:原意是考试的时候带的小抄,所以说是 cheat(作弊) sheet。在计算机科学领域里,主要是指记录一些难记命令或者操作的快查…

利用 OpenCV+ConvNets 检测几何图形
作者 | 小白 来源 | 小白学视觉 导读 人工智能领域中增长最快的子领域之一是自然语言处理(NLP),它处理计算机与人类(自然)语言之间的交互,特别是如何编程计算机以处理和理解大量自然语言数据。 自然语言处理…

《Linux实践及应用》
2019独角兽企业重金招聘Python工程师标准>>> 《Linux实践及应用》 本书以RedHat 9.0为蓝本,系统地介绍Linux的基础知识、Linux系统的安装与配置、常用命令,以及如何进行Linux系统管理和基本的网络服务设置(包括如何设置DNS服务器、…
找不到包含 OwinStartupAttribute 的程序集
2019独角兽企业重金招聘Python工程师标准>>> 尝试加载应用时出现了以下错误。 找不到包含 OwinStartupAttribute 的程序集。找不到包含 Startup 或 [AssemblyName].Startup 类的程序集。 若要禁用 OWIN 启动发现,请在 web.config 中为 appSetting owin:A…

Imagination 推新款GPU IP,首次实现桌面级光线追踪效果
游戏界被炒得最热的概念可能就是光线追踪技术了,不仅仅是PC端的游戏。光线追踪所展示出来的画面效果也确实惊艳,可以让我们感叹到图像技术达到的一个新高度。 但是实际上,光线追踪并不是一个新技术。10年前,光追就是游戏玩家茶余…
percent之集合
2019独角兽企业重金招聘Python工程师标准>>> 这个留到明天再来写吧,今天把hub剩下的坑填掉. 转载于:https://my.oschina.net/u/2011113/blog/416458

Mr. Process的一生-Linux内核的社会视角 (2)启动
原文地址: http://www.manio.org/cn/startup-of-linux-view-of-society.html 其实这才应该是这一系列文章的第一节,因为这篇文章讲的是盘古开天地的事。话说Mr. Process是一个现代人,但是,只要是人,总该有个祖先。人们…
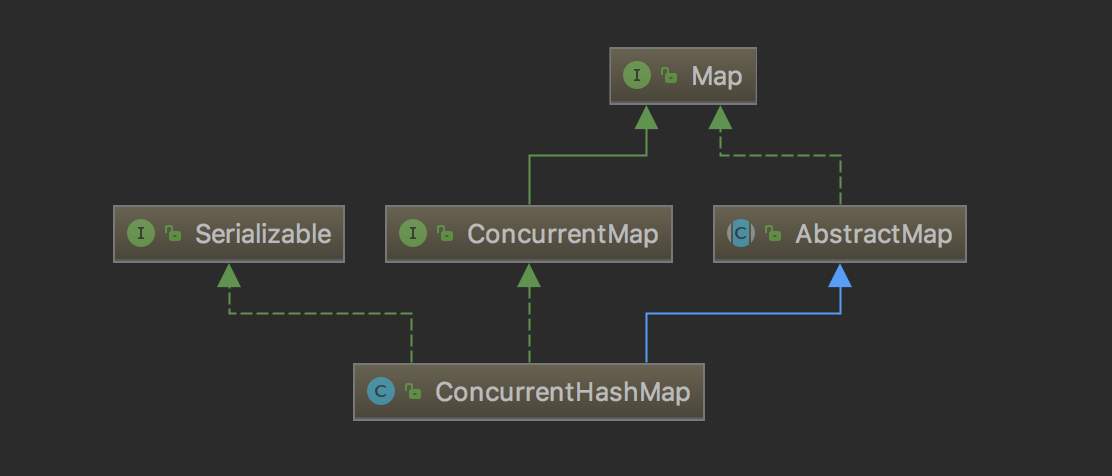
深入研究ConcurrentHashMap 源码从7到8的变迁
ConcurrentHashMap是线程安全且高效的HashMap 1 为什么要使用ConcurrentHashMap 线程不安全的HashMap HashMap是Java中最常用的一个Map类,性能好、速度快,但不能保证线程安全,它可用null作为key/value HashMap的线程不安全主要体现在resize时…
IANA定义的常见服务的端口号列表
最新明细:http://www.iana.org/assignments/port-numbers 几个重要常见端口: 21 FTP 22 SSH 80 HTTP 443 HTTPS 1433 MSSQLserver 3306 MySQL 11211 memcached