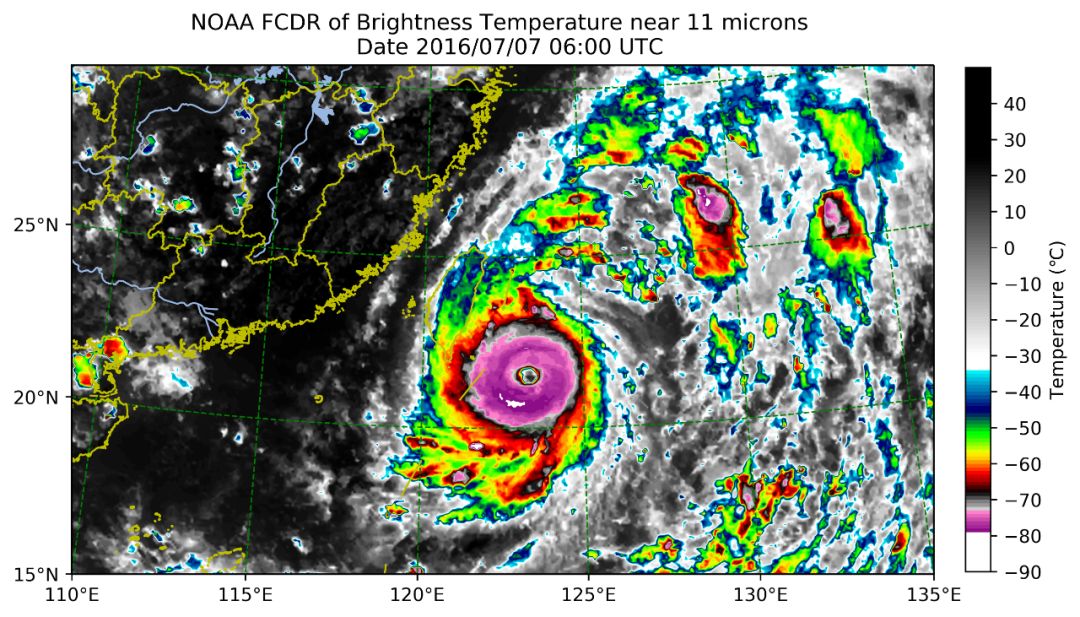
python代码画皮卡丘_Python气象绘图实例我们一起画台风(代码+数据)
前段时间袭击中国的超强台风“利奇马”,以及这两天袭击美国的五级飓风“多利安”,让我们感受到了大自然的力量。所以,今天分享一个简单的Python实例,也算是延续前面python气象绘图系列(点击链接1;点击链接2),与大家交流如何选择合适的色标来绘制台风云顶亮温展示台风的部分特征。配色方案借鉴了GOES-16 Data[1]数据的处理方法。我们此次针对于中国区域进行一个展示,数据选取GridSat-B1 CDR(数据下载地址)[2]. A climate quality, long term dataset of global infrared window brightness temperatures. 1981-present (updated quarterly)。
如果在业务绘图或者科研中使用文中提供的脚本有问题,也欢迎加入MeteoAI的微信交流群一起交流,也可以添加我的微信(gavin7675)交流探讨。
对不起,放错图了!不过,动态展示台风也是很有必要,后续试着复现一下。

目标:绘制中国区域(邻近海域)台风,展示台风的部分特征,绘制经纬度网格线,附带经纬度信息,基本的地界信息。
工具:Python3.6+(Anaconda)、cpt文件/处理python脚本、地理界线、一系列相关的Python库、测试数据
1.出图
效果图:
2.数据、脚本
链接:https://pan.baidu.com/s/1lXA1jlmZrG09rj5OhAoSXg 密码:sojk
3.代码展示
import matplotlib
matplotlib.use('TkAgg')
import os,sys
import scipy.ndimage
import numpy as np
import xarray as xr
from copy import copy
import matplotlib.pyplot as plt # Import the Matplotlib package
from mpl_toolkits.basemap import Basemap # Import the Basemap toolkit
from cpt_convert import loadCPT # Import the CPT convert function
from matplotlib.colors import LinearSegmentedColormap # Linear interpolation for color maps
import cartopy.crs as ccrs
import cartopy.feature as cfeature
from cartopy.mpl.gridliner import LATITUDE_FORMATTER, LONGITUDE_FORMATTER
import shapely.geometry as sgeom

def find_side(ls, side):
    """
 Given a shapely LineString which is assumed to be rectangular, return the
 line corresponding to a given side of the rectangle.
 """
    minx, miny, maxx, maxy = ls.bounds
    points = {'left': [(minx, miny), (minx, maxy)],
              'right': [(maxx, miny), (maxx, maxy)],
              'bottom': [(minx, miny), (maxx, miny)],
              'top': [(minx, maxy), (maxx, maxy)],}
    return sgeom.LineString(points[side])

def lambert_xticks(ax, ticks):
    """Draw ticks on the bottom x-axis of a Lambert Conformal projection."""
    te = lambda xy: xy[0]
    lc = lambda t, n, b: np.vstack((np.zeros(n) + t, np.linspace(b[2], b[3], n))).T
    xticks, xticklabels = _lambert_ticks(ax, ticks, 'bottom', lc, te)
    ax.xaxis.tick_bottom()
    ax.set_xticks(xticks)
    ax.set_xticklabels([ax.xaxis.get_major_formatter()(xtick) for xtick in xticklabels])

def lambert_yticks(ax, ticks):
    """Draw ricks on the left y-axis of a Lamber Conformal projection."""
    te = lambda xy: xy[1]
    lc = lambda t, n, b: np.vstack((np.linspace(b[0], b[1], n), np.zeros(n) + t)).T
    yticks, yticklabels = _lambert_ticks(ax, ticks, 'left', lc, te)
    ax.yaxis.tick_left()
    ax.set_yticks(yticks)
    ax.set_yticklabels([ax.yaxis.get_major_formatter()(ytick) for ytick in yticklabels])

def _lambert_ticks(ax, ticks, tick_location, line_constructor, tick_extractor):
    """Get the tick locations and labels for an axis of a Lambert Conformal projection."""
    outline_patch = sgeom.LineString(ax.outline_patch.get_path().vertices.tolist())
    axis = find_side(outline_patch, tick_location)
    n_steps = 30
    extent = ax.get_extent(ccrs.PlateCarree())
    _ticks = []
    for t in ticks:
        xy = line_constructor(t, n_steps, extent)
        proj_xyz = ax.projection.transform_points(ccrs.Geodetic(), xy[:, 0], xy[:, 1])
        xyt = proj_xyz[..., :2]
        ls = sgeom.LineString(xyt.tolist())
        locs = axis.intersection(ls)
        if not locs:
            tick = [None]
        else:
            tick = tick_extractor(locs.xy)
        _ticks.append(tick[0])
    # Remove ticks that aren't visible:
    ticklabels = copy(ticks)
    while True:
        try:
            index = _ticks.index(None)
        except ValueError:
            break
        _ticks.pop(index)
        ticklabels.pop(index)
    return _ticks, ticklabels


# 区域选择
lat_s = 15
lat_n = 30
lon_w = 110
lon_e = 135


# Load the border data, CN-border-La.dat is downloaded from
# https://gmt-china.org/data/CN-border-La.dat
with open('CN-border-La.dat') as src:
    context = src.read()
    blocks = [cnt for cnt in context.split('>') if len(cnt) > 0]
    borders = [np.fromstring(block, dtype=float, sep=' ') for block in blocks]


path = '/Users/zhpfu/Dropbox/Code_Fortress/00_My_Python_Library/Typhoon/GRIDSAT-B1.2016.07.07.06.v02r01.nc'

# Search for the Scan start in the file name  2016.07.07.06
Start = (path[path.find("B1.")+3:path.find(".v02")])
Start_Formatted = " Date "+ Start[0:4] + "/" + Start[5:7] + "/" + Start [8:10]+ " " + Start [11:13]+":00 UTC"

print(Start_Formatted)


# Set figure size
proj = ccrs.LambertConformal(central_longitude=(lon_w+lon_e)/2., central_latitude= (lat_s+lat_n)/2.,
                             false_easting=400000, false_northing=400000)#,standard_parallels=(46, 49))

fig = plt.figure(figsize=[10, 8],frameon=True)

print("AAAAAA")

# Set projection and plot the main figure
ax = fig.add_axes([0.08, 0.05, 0.8, 0.94], projection=proj)

# Set figure extent
ax.set_extent([lon_w, lon_e, lat_s, lat_n],crs=ccrs.PlateCarree())

# Plot border lines
for line in borders:
    ax.plot(line[0::2], line[1::2], '-', lw=1.0, color='y',
            transform=ccrs.Geodetic())

# Add ocean, land, rivers and lakes
ax.add_feature(cfeature.OCEAN.with_scale('50m'))
ax.add_feature(cfeature.LAND.with_scale('50m'))
ax.add_feature(cfeature.RIVERS.with_scale('50m'))
ax.add_feature(cfeature.LAKES.with_scale('50m'))

print("BBBBBB")

# *must* call draw in order to get the axis boundary used to add ticks:
fig.canvas.draw()

# Define gridline locations and draw the lines using cartopy's built-in gridliner:
# xticks = [] ; yticks = []
npts   = 5
xticks = list(np.arange(lon_w-15,lon_e+15+1,npts))
yticks = list(np.arange(lat_s-15,lat_n+15+1,npts))


ax.gridlines(xlocs=xticks, ylocs=yticks,linestyle='--',lw=0.85,color='green')# dimgrey

# Label the end-points of the gridlines using the custom tick makers:
ax.xaxis.set_major_formatter(LONGITUDE_FORMATTER)
ax.yaxis.set_major_formatter(LATITUDE_FORMATTER)

# https://stackoverflow.com/questions/30030328/correct-placement-of-colorbar-relative-to-geo-axes-cartopy
lambert_xticks(ax, xticks)
lambert_yticks(ax, yticks)


print("CCCCCC")

# Converts a CPT file to be used in Python
cpt = loadCPT('IR4AVHRR6.cpt')
# Makes a linear interpolation
cpt_convert = LinearSegmentedColormap('cpt', cpt)


ds    = xr.open_dataset(path)
lat   = ds.lat
lon   = ds.lon
time  = ds.time
data0 = (ds['irwin_cdr'][0,:,:] - 273.15 ) # 把温度转换为℃  - 273.15


lon_range = lon[(lon>lon_w-5) & (lon5)]
lat_range = lat[(lat>lat_s-5) & (lat5)]
data     = data0.sel(lon=lon_range, lat=lat_range)
print(data)
print(time)# 设置colorbar #get size and extent of axes:
cbar_kwargs = {'orientation': 'vertical',    #'horizontal','label': 'Temperature (℃)','ticks': np.arange(-90, 40 + 1, 10),'pad': 0.03,'shrink': 0.51
}
levels = np.arange(-90, 50 + 1, 1) # .reversed() ,, vmin=-90, vmax=50, .reversed() # # Resample your data grid by a factor of 3 using cubic spline interpolation.# data = scipy.ndimage.zoom(data, 3)# # from scipy.ndimage.filters import gaussian_filter# sigma = 0.7 # this depends on how noisy your data is, play with it!# data = gaussian_filter(data, sigma)#
data.plot.contourf(ax=ax, levels=levels, vmin=-90, vmax=50, cmap=cpt_convert, origin='upper',
                   cbar_kwargs=cbar_kwargs, transform=ccrs.PlateCarree())#http://xarray.pydata.org/en/stable/plotting.html
plt.ylabel('')    #Remove the defult  lat / lon label
plt.xlabel('')
print("DDDDDD")# Add a title to the plot
plt.title("NOAA FCDR of Brightness Temperature near 11 microns "+ "\n " + Start_Formatted)# Save & Show figure
(filename, extension) = os.path.splitext(os.path.basename(sys.argv[0]))
plt.savefig(filename+".png", dpi=600, bbox_inches='tight')
print("EEEEEE")
plt.show()本文同步更新在微信公众号『气象学家』
往期推荐
Pandas从小白到大师Python绘制气象实用地图[Code+Data](续)Python绘制气象实用地图(附代码和测试数据)用机器学习应对气候变化?最易写出bug?Python命名空间和作用域介绍捍卫祖国领土从每一张地图开始Nature(2019)-地球系统科学领域的深度学习及其理解交叉新趋势|采用神经网络与深度学习来预报降水、温度等案例(附代码/数据/文献)References
[1] GOES-16 Data: https://geonetcast.wordpress.com/2017/06/02/geonetclass-manipulating-goes-16-data-with-python-part-v/[2] (数据下载地址): https://www.ncdc.noaa.gov/gridsat/gridsat-index.php
相关文章:

Windows Socket编程笔记之最简单的小Demo
Windows Socket编程的大致过程:服务器端:----过程-------------对应的API------- 0.初始化 | WSAStartup() 1.创建Socket | socket() 2.绑定Socket | bind() 3.监听 | listen() 4.接受连接 | accept() 5.接收/发送数据 | recv()/send()…
React项目实战
一、环境搭建 1.安装react-cli脚手架(保证提前安装好Node最新版本) npm config set registry http://registry.npm.taobao.org/ npm config set sass-binary-site http://npm.taobao.org/mirrors/node-sass npm isntall -g create-react-app 2.查看react…
win7完美兼容DynamipsGUI(小凡模拟器)攻略
博主又是好久没写了,今天闲来无事与大家一起分享一下如何在windows7平台下完美兼容DynamipsGUI(小凡模拟器)的一个小窍门~ 对于学习cisco的朋友来说,DynamipsGUI(小凡模拟器)一定不陌生,在这就不…
使用PHPExcel 对表格进行,读取和写入的操作。。。。
下面的代码是使用PHPExcel 对多个表格数据进行读取, 然后整合的写入新的表格的方法!!!代码有点粗糙 , 多多保函!!! 这里有些地方注意下,如果你的表格数据过大,…
c# .netframwork 4.0 调用 2.0时报错 混合模式程序集是针对“v2.0.50727”版的运行时生成的,在没有配置其他信息的情况下,无法在 4.0 运行时中加载该程序集。...
“System.IO.FileLoadException”类型的未经处理的异常在 XXX.dll 中发生 其他信息: 混合模式程序集是针对“v2.0.50727”版的运行时生成的,在没有配置其他信息的情况下,无法在 4.0 运行时中加载该程序集。 这时需要改dbconfig配置 在configuration 节点…
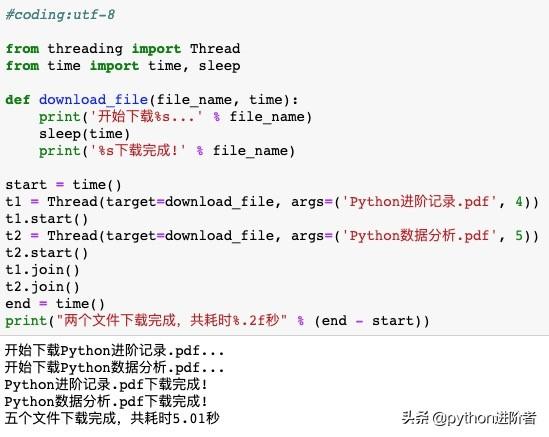
python多线程并发_Python进阶记录之基础篇(二十四)
回顾在Python进阶记录之基础篇(二十三)中,我们介绍了进程的基本概念以及Python中多进程的基本使用方法。其中,需要重点掌握多进程的创建方法、进程池和进程间的通信。今天我们讲一下Python中的多线程。线程的基本概念线程是操作系统能够进行运算调度的最…
awk处理文件内容格式
今天运营出了点问题,需要对特定时间段充值数做一个处理,文件格式有特定要求,要符合erlang的格式{roleID,gold}.mysql导出所有数据结果如下【取部分数据看】:kuwo 4 50004106230500 100kuwo 4 50004106230900 …
QQ远程协助没动静?QQ版本有讲究
一位网友觉得电脑反应速度慢了,想通过QQ远程协助让我处理一下。不料接受请求后,等了许久都显示网友电脑的桌面,而网友那边QQ也没有任何提示。 反复尝试了几次都是如此。 询问网友得知他用的QQ为2011版,而我使用的QQ是2008版。难…
java课堂测试样卷-----简易学籍管理系统
程序设计思路:分别建立两个类:ScoreInformation类(用来定义学生的基本信息以及设置set和get函数)ScoreManagement类(用来定义实现学生考试成绩录入,考试成绩修改,绩点计算等功能的函数)和一个主…
python3安装setuptools步骤_setuptools、pip的安装
第2篇分享 安装setuptools 下载setuptools源码setuptools-25.2.0.tar.gz选择需要的版本 这是一个压缩文件,将其解压到桌面,并进入该文件夹 按住shift键后,在文件夹空白处点击鼠标右键,选择:在此处打开命令窗重点&#…
如何将简单CMS后台管理系统示例转换为Java、Php等不同后台语言的版本
等下要去坐车,今天就不继续唠叨开发过程了,来谈一下普遍比较关心的后台语言问题。学习Ext JS,笔者一直强调学习的中心思路是“界面与数据是分离”。只要好好掌握这个思路,深入了解Ext JS的运作过程,就不会为后台语言使…
[面试]future模式
Future模式 什么是future模式? 传统单线程环境下,调用函数是同步的,必须等待程序返回结果后,才可进行其他处理。 Futrue模式下,调用方式改为异步。 Futrue模式的核心在于:充分利用主函数中的等待时间,利用…
java ide
tidespringsource sts a vmware product plugin:Aptana Studio 3(集成了Git) Run on Jettyeclipse for jee plugin:JBoss Tools,m2eclipe,spirng tools,svn

成长秘笈:是你教我,不是我教你
郑昀 20180622 “谢谢你,你是第一个面试的时候跟我说这么详细的。那我到你们公司之后怎么就能成长了呢?” “你们这些人最大的问题是出不了方案。 为什么出不了方案? 因为没有养成深度思考问题的习惯。 实现方案、算法、数据迁移、准备数据、…
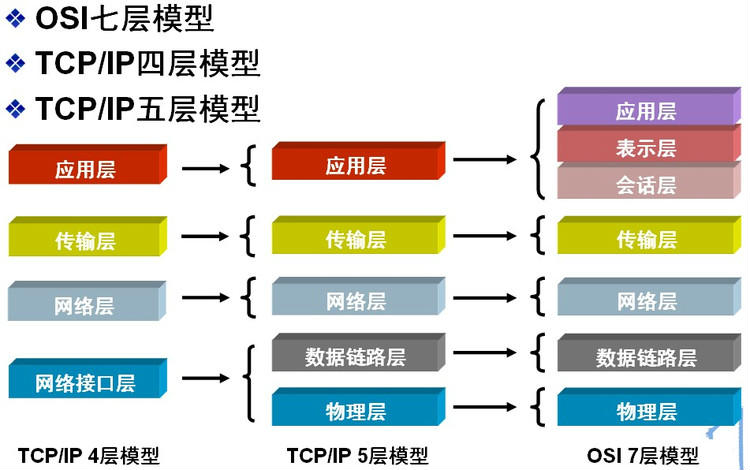
计算机网络面试题(一)
1、OSI,TCP/IP,五层协议的体系结构,以及各层协议 OSI分层 (7层):物理层、数据链路层、网络层、传输层、会话层、表示层、应用层。 TCP/IP分层(4层):网络接口 网络层、运…
Ubuntu下安装和配置Apache2
在Ubuntu中安装apache 安装指令:sudo apt-get install apache2 安装结束后: 产生的启动和停止文件是:/etc/init.d/apache2 启动:sudo apache2ctl -k start 停止:sudo apache2ctl -k stop 重新启动:sudo apa…
苹果电脑安装python3密码_mac系统安装Python3初体验
前沿 对于iOS开发不要随便拆卸系统自带的Python,因为有很多 library 还是使用 Python2.7。 1 安装Xcode 1.1 App Store 搜索Xcode 并安装 1.2 安装 Xcode command line tool 1.2.1 打开命令行terminal工具 control space 输入terminal 回车 1.2.2 安装Xcode command line tool…
【IBM Tivoli Identity Manager 学习文档】3 系统部署
作者:gnuhpc 出处:http://www.cnblogs.com/gnuhpc/ ITIM 5.0 单服务器配置和部署。 部署ITIM之前要对其组件进行部署: IBM DB2 Enterprise 9.1 with FP2 IBM WebSphere Application Server 6.1 with FP9 IBM Tivoli Directory Server 6.2 IB…
数据结构Java版之红黑树(八)
红黑树是一种自动平衡的二叉查找树,因为存在红黑规则,所以有效的防止了二叉树退化成了链表,且查找和删除的速度都很快,时间复杂度为log(n)。 什么是红黑规则? 1.根节点必须是黑色的。 2.节点颜色要么是红要么是黑。 3.…

你真的了解Grid布局吗?
Grid网格布局 概述:Grid将容器划分为一个个网格,通过任意组合不同的网格,做出你想想要的布局 Grid与flex布局相似,将整个Grid分为了容器与子项(格子) Grid容器的三个重要的概念: 行和列单元格网…
webform里的验证控件
1.非空验证控件:RequireFieldValidator ;2.数据比较验证:CompareValidator ;3.数据范围验证:RangeValidator ;4.正则表达式验证:RegularExpressionValidator ;5.自定义条件验证&…

hash是线程安全的吗?怎么解决?_这次进程、线程、多线程和线程安全问题,一次性帮你全解决了...
1. 什么是进程一个软件,在操作系统中运行时,我们称其为进程。进程是操作系统分配资源的最小单元,线程是操作系统调度的最小单元。2. 什么是线程在一个进程中,每个独立的功能都需要独立的去运行,这时又需要把当前这个进…

WinXP不能共享Win7的打印机的解决方法
现在很多企业里存在着WinXP和Win7混用,WinXP不能正常共享Win7的文件和打印机,经过设置发现Win7可以Ping通Winxp并且也可以发现WinXP的共享文件,可是WinXP却不能共享Win7的文件和打印机,看了一下相关资料后简单设置就解决了这个问题…
第三阶段 10_JavaWeb基础_
因为要准备接本,不一定能够每天更新 转载于:https://www.cnblogs.com/BaiZe258/p/9251075.html

工厂模式(Factory)(转)
先来明确一个问题,那就是有的时候,实例化这个活动不应该总是公开的进行, 也就是不要公开的使用 new 操作符,因为,这样容易造成耦合问题。 我们不应该针对实现编程,但是当我们在使用 new 的时候,…
Asp.net后台创建HTML
为了使HTML界面中的内容能根据数据库中的内容动态显示用户需要的内容,或者根据权限不同要显示同而实现页面内容的动态创建 使用HtmlGenericControl创建HTML标签 引入命名空间: using System.Web.UI.HtmlControls; 更改其属性: hgg_div.Attributes.Add("style&q…
oracle视图(转)
视图的概念 视图是基于一张表或多张表或另外一个视图的逻辑表。视图不同于表,视图本身不包含任何数据。表是实际独立存在的实体,是用于存储数据的基本结构。而视图只是一种定义,对应一个查询语句。视图的数据都来自于某些表,这些…
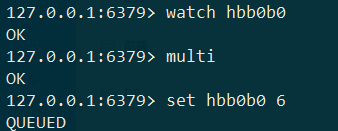
Redis 事物
redis 事物: Redis 事物的实现: 首先 wath监控键值 myKey开启批量执行 multi,执行命令入列,执行 exec 。如果监控的键值mykey 没有被修改过,则exec 中批量执行的命令成功,否则执行失败。无论执行成功与否&a…
python dos攻击_利用SMB漏洞DoS攻击任何Windows系统
原标题:利用SMB漏洞DoS攻击任何Windows系统近日微软报出SMB V1存在漏洞,安全研究员并将此漏洞称作 “ SMBLoris ”,解释其能够发动拒绝服务(Dos)攻击,可以感染 Windows 2000 及以上操作系统的任一版本 SMB …
java基础编程题(2)
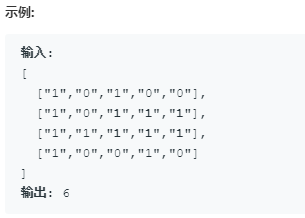
1、给定一个二叉树,找出其最大深度。 注:二叉树的深度为根节点到最远叶子节点的最长路径上的节点数。 /*** Definition for a binary tree node.* public class TreeNode {* int val;* TreeNode left;* TreeNode right;* TreeNode(int x…