运维日志管理系统
因公司数据安全和分析的需要,故调研了一下
GlusterFS + lagstash + elasticsearch + kibana 3 + redis 整合在一起的日志管理应用:
安装,配置过程,使用情况等续
一,glusterfs分布式文件系统部署:
说明:
公司想做网站业务日志及系统日志统一收集和管理,经过对mfs, fastdfs 等分布式文件系统的调研,最后选择了 glusterfs,因为Gluster具有高扩展性、高性能、高可用性、可横向扩展的弹性特点,无元数据服务器设计使glusterfs没有单点故障隐患,官网:www.gluster.org
1. 系统环境准备:
Centos 6.4
服务端:
192.168.10.101
192.168.10.102
192.168.10.188
192.168.10.189
客户端:
192.168.10.103
EPEL源和GlusterFS源
增加EPEL源和GLusterFS源,EPEL源中包含GLusterFS,版本比较旧,相对稳定,本次测试采用最新的3.5.0版本。
rpm -Uvh http://dl.fedoraproject.org/pub/epel/6/x86_64/epel-release-6-8.noarch.rpm
wget -P /etc/yum.repos.dhttp://download.gluster.org/pub/gluster/glusterfs/LATEST/CentOS/glusterfs-epel.repo
2. 部署过程
服务端安装:
yum -y install glusterfs glusterfs-fuseglusterfs-server
chkconfig glusterd on
service glusterd start
服务端配置:
将4个存储节点组成一集群,本文在第一个节点执行,只需要在任意节点执行就ok。
[root@db1 ~]# gluster peer probe192.168.10.102
probe successful
[root@db1 ~]# gluster peer probe192.168.10.188
probe successful
[root@db1 ~]# gluster peer probe 192.168.10.189
probe successful
查看集群的节点信息:
[root@db1 ~]# gluster peer status
number of peers: 3
hostname: 192.168.10.102
uuid:b9437089-b2a1-4848-af2a-395f702adce8
state: peer in cluster (connected)
hostname: 192.168.10.188
uuid: ce51e66f-7509-4995-9531-4c1a7dbc2893
state: peer in cluster (connected)
hostname: 192.168.10.189
uuid:66d7fd67-e667-4f9b-a456-4f37bcecab29
state: peer in cluster (connected)
以/data/gluster为共享目录,创建名为test-volume的卷,副本数为2:
sh cmd.sh "mkdir /data/gluster"
[root@db1 ~]# gluster volume create test-volume replica 2192.168.10.101:/data/gluster 192.168.10.102:/data/gluster192.168.10.188:/data/gluster 192.168.10.189:/data/gluster
creation of volume test-volume has beensuccessful. please start the volume to access data.
启动卷:
[root@db1 ~]# gluster volume starttest-volume
starting volume test-volume has beensuccessful
查看卷状态:
[root@db1 ~]# gluster volume info
volume name: test-volume
type: distributed-replicate
status: started
number of bricks: 2 x 2 = 4
transport-type: tcp
bricks:
brick1: 192.168.10.101:/data/gluster
brick2: 192.168.10.102:/data/gluster
brick3: 192.168.10.188:/data/gluster
brick4: 192.168.10.189:/data/gluster
3. 客户端安装配置:
安装:
yum -y installglusterfs glusterfs-fuse
挂载:
mount -t glusterfs 192.168.10.102:/test-volume/mnt/ (挂载任意一个节点即可)推荐用这种方式。
mount -t nfs -o mountproto=tcp,vers=3192.168.10.102:/test-volume /log/mnt/ (使用nfs挂载,注意远端的rpcbind服务必须开启)
echo "192.168.10.102:/test-volume/mnt/ glusterfs defaults,_netdev 0 0" >> /etc/fstab (开机自动挂载)
4. 测试
检查文件正确性
dd if=/dev/zero of=/mnt/1.img bs=1Mcount=1000 # 在挂载客户端生成测试文件
cp /data/navy /mnt/ # 文件拷贝到存储上
宕机测试。
使用glusterfs-fuse挂载,即使目标服务器故障,也完全不影响使用。用NFS则要注意挂载选项,否则服务端故障容易导致文件系统halt住而影响服务!
# 将其中一个节点停止存储服务service glusterd stop
service glusterfsd stop# 在挂载客户端删除测试文件
rm -fv /mnt/navy# 此时在服务端查看,服务被停止的节点上navy并未被删除。此时启动服务:serviceglusterd start# 数秒后,navy就被自动删除了。新增文件效果相同!
5. 运维常用命令:
删除卷
gluster volume stop test-volume
gluster volume delete test-volume
将机器移出集群
gluster peer detach 192.168.10.102
只允许172.28.0.0的网络访问glusterfs
gluster volume set test-volumeauth.allow 192.168.10.*
加入新的机器并添加到卷里(由于副本数设置为2,至少要添加2(4、6、8..)台机器)
gluster peer probe 192.168.10.105
gluster peer probe 192.168.10.106
gluster volume add-brick test-volume192.168.10.105:/data/gluster 192.168.10.106:/data/gluster
收缩卷
# 收缩卷前gluster需要先移动数据到其他位置
gluster volume remove-brick test-volume192.168.10.101:/data/gluster/test-volume192.168.10.102:/data/gluster/test-volume start
# 查看迁移状态
gluster volume remove-brick test-volume192.168.10.101:/data/gluster/test-volume192.168.10.102:/data/gluster/test-volume status
# 迁移完成后提交
gluster volume remove-brick test-volume192.168.10.101:/data/gluster/test-volume192.168.10.102:/data/gluster/test-volume commit
迁移卷
# 将192.168.10.101的数据迁移到,先将192.168.10.107加入集群
gluster peer probe 192.168.10.107
gluster volume replace-bricktest-volume 192.168.10.101:/data/gluster/test-volume192.168.10.107:/data/gluster/test-volume start
# 查看迁移状态gluster volume replace-brick test-volume192.168.10.101:/data/gluster/test-volume192.168.10.107:/data/gluster/test-volume status
# 数据迁移完毕后提交gluster volume replace-brick test-volume192.168.10.101:/data/gluster/test-volume192.168.10.107:/data/gluster/test-volume commit
# 如果机器192.168.10.101出现故障已经不能运行,执行强制提交然后要求gluster马上执行一次同步
gluster volume replace-bricktest-volume 192.168.10.101:/data/gluster/test-volume192.168.10.102:/data/gluster/test-volume commit -force
gluster volume heal test-volumes full
24007
二.日志收集系统部署
说明简解:
系统各部分应用介绍
Logstash:做系统log收集,转载的工具。同时集成各类日志插件,对日志查询和分析的效率有很大的帮助.一般使用shipper作为log收集、indexer作为log转载.
Logstash shipper收集log 并将log转发给redis 存储
Logstash indexer从redis中读取数据并转发给elasticsearch
redis:是一个db,logstash shipper将log转发到redis数据库中存储。Logstash indexer从redis中读取数据并转发给elasticsearch。
Elasticsearch:开源的搜索引擎框架,前期部署简单,使用也简单,但后期需要做必要的优化具体请参照博客http://chenlinux.com/categories.html#logstash-ref 中logstash部分.可进行多数据集群,提高效率。从redis中读取数据,并转发到kibana中
Kibana: 开源web展现。
虚拟服务器准备:
192.168.10.143 logstash shipper
192.168.10.144 logstash indexer redis
192.168.10.145 elasticsearch kibana3
1.三台主机都要安装jdk 1.7
推荐oracle jdk 1.7+版本
java -version
设置java的环境变量,比如
vim~/.bashrc
>>
JAVA_HOME=/usr/java/jdk1.7.0_55
PATH=$PATH:/$JAVA_HOME/bin
CLASSPATH=.:$JAVA_HOME/lib
JRE_HOME=$JAVA_HOME/jre
export JAVA_HOME PATH CLASSPATH JRE_HOME
>>
source ~/.bashrc
2.安装redis(192.168.10.144)
wgethttp://download.redis.io/releases/redis-2.6.16.tar.gz
tar -zxf redis-2.6.16.tar.gz
cd redis-2.6.16
make && make install
./src/redis-server ../redis.conf
启动redis客户端来验证安装
./src/redis-cli
> keys * #列出所有的key
3.安装Elasticsearch(192.168.10.145)
wgethttp://download.elasticsearch.org/elasticsearch/elasticsearch/elasticsearch-0.90.13.zip
unzipelasticsearch-0.90.13.zip
elasticsearch解压即可使用非常方便,接下来我们看一下效果,首先启动ES服务,切换到elasticsearch目录,运行bin下的elasticsearch
cd elasticsearch-0.90.13
bin/elasticsearch -f
访问默认的9200端口
curl -X GET http://localhost:9200
4.安装logstash (192.168.10.143 ,192.168.10.144)
wgethttp://download.elasticsearch.org/logstash/logstash/logstash-1.2.1-flatjar.jar
logstash下载即可使用,命令行参数可以参考logstash flags,主要有
agent #运行Agent模式
-f CONFIGFILE #指定配置文件
web #自动Web服务
-p PORT #指定端口,默认9292
5. 安装kibana(192.168.10.145)
logstash的最新版已经内置kibana,你也可以单独部署kibana。kibana3是纯粹JavaScript+html的客户端,所以可以部署到任意http服务器上。
wgethttp://download.elasticsearch.org/kibana/kibana/kibana-latest.zip
unzip kibana-latest.zip
cp-r kibana-latest /var/www/html
可以修改config.js来配置elasticsearch的地址和索引。
修改以下行。
elasticsearch:"http://192.168.10.145:9200",
6. 整合配置:
192.168.10.143 logstash shipper 配置收集日志
Vim /etc/logstash_shipper.conf
input{
file {
type => "linux-syslog"
path => [ "/var/log/lastlog", "/var/log/syslog","/var/log/lastlog" ]
}
}
output {
redis {
host => "192.168.10.144"
port => “6379”
data_type =>"list"
key => "syslog"
}
}
启动logstash shipper
Nohup java –jar logstash-1.2.1-flatjar.jar agent –f /etc/ logstash_shipper.conf &
过十秒后,输出如下信息:
Using milestone 2input plugin 'file'. This plugin should be stable, but if you see strangebehavior, please let us know! For more information on plugin milestones, seehttp://logstash.net/docs/1.2.2/plugin-milestones {:level=>:warn}
Using milestone 2 output plugin 'redis'.This plugin should be stable, but if you see strange behavior, please let usknow! For more information on plugin milestones, see http://logstash.net/docs/1.2.2/plugin-milestones{:level=>:warn}
192.168.10.144 logstash indexer 配置如下:
Vim /etc/logstash_indexer.conf
input{
redis
{
host => "192.168.10.144"
data_type =>"list"
port => "6379"
key => "syslog"
type => "redis-input"
}
}
output
{
elasticsearch {
host => "192.168.10.145"
port => "9300"
}
}
启动logstash indexer
Nohup java –jar logstash-1.2.1-flatjar.jar agent –f /etc/ logstash_indexer.conf &
输出同上。
7. 登录 http://192.168.10.145/kibana 访问如下

三,整合分布式文件存储和日志收集系统
逻辑图如下:

把glusterfs 挂载到web服务器端,具体需要编写日志结构化程序配合日志写到glusterfs存储上。
转载于:https://blog.51cto.com/shantu/1440029
相关文章:

NLP学习思维导图,非常的全面和清晰
作者 | Tae Hwan Jung & Kyung Hee编译 | ronghuaiyang【导读】Github上有人整理了NLP的学习路线图(思维导图),非常的全面和清晰,分享给大家。先奉上GitHub地址:https://github.com/graykode/nlp-roadmapnlp-roadm…
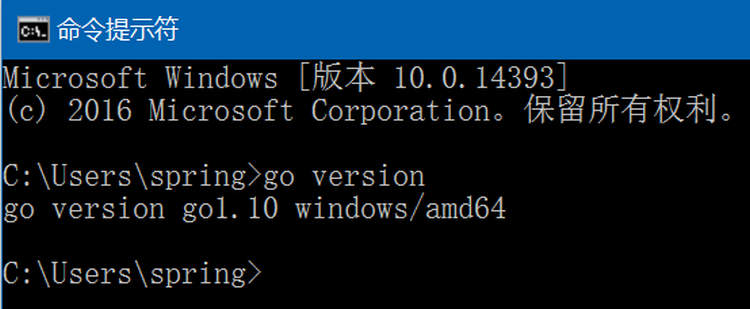
Go在windows10 64位上安装过程
1. 从 https://golang.org/dl/ 下载最新的发布版本go1.10即go1.10.windows-amd64.msi; 2. 双击go1.10.windows-amd64.msi ,使用默认选项,默认会安装到C:\Go目录下; 3. 将C:\Go\bin目录添加到系统环境变量中(默认已自动添加),此目录下有go.exe…

Windows SharePoint Services 3.0 应用程序模板
微软发布的一些WSS模板,看了一下,跟以前看到的模板好像不同模板分两类,一类是站点管理模板,一类是服务器管理模板站点管理模板:董事会、业务绩效报告、政府机构案例管理、课堂管理、临床试验启动和管理、竞争性分析站点…
HAProxy+Keepalived高可用负载均衡配置
一、系统环境:系统版本:CentOS5.5 x86_64master_ip:172.20.27.40backup_ip:172.20.27.50 vip:172.20.27.200web_1: 172.20.27.90web_2:172.20.27.100二、haproxy安装:1.首先172.20.27.40安装上安装:1.1安装 tar zxvf haproxy-1.3.…
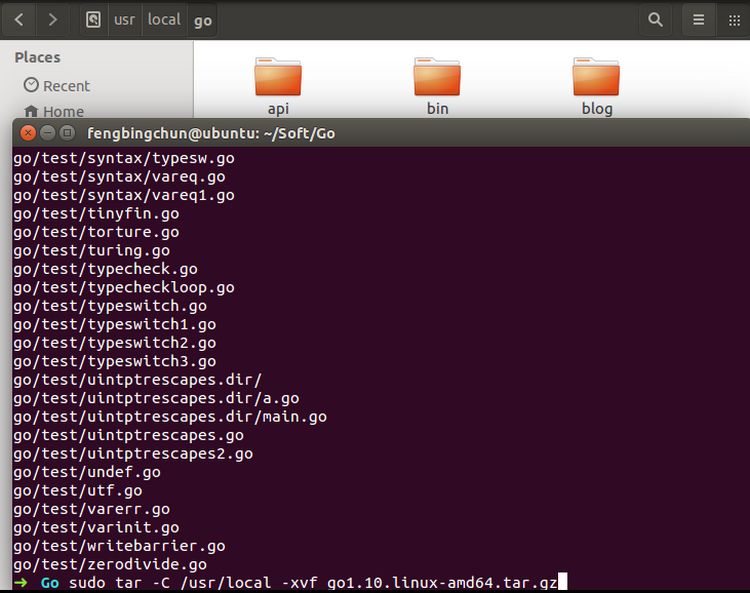
Go在Ubuntu 14.04 64位上的安装过程
1. 从 https://golang.org/dl/ 或 https://studygolang.com/dl 下载最新的发布版本go1.10即go1.10.linux-amd64.tar.gz; 2. 将下载的tar包解压缩到/usr/local目录下,执行以下命令,结果如下: $ sudo tar -C /usr/local -xzf go1.…

毕业就拿阿里offer,你和他比差在哪?
我在大学的时候,真的遇到一个神人,叫他小马吧。超前学习。1024,是程序员的节日,恰逢CSDN的20周年,我们准备为你做件大事!我们与AI博士唐宇迪、畅销书作家、北大硕士阿甘等4位老师,共同为大家带来…
04号团队-团队任务5:项目总结会
1.团队信息 团队序号:04 开发项目:北软毕设管理系统 整理人:丛云聪 学号:2017035107185 在团队中的职务:项目经理兼产品经理 2.代码仓库地址 主仓库:https://gitee.com/The_Old_Cousin/StuInfoManage…
微软职位内部推荐-Sr SDE for Win Apps Ecosystem
微软近期Open的职位:Job posting title: Senior Software Design EngineerLocation: China, BeijingLevel: 63Division: Operations System Group EngineeringGroup OverviewOSG is delivering flagship products in Microsoft. China is a second largest economy in the worl…

C# Winform 启动和停止进程
启动和停止进程 一、启动进程 方法1: (1) 创建一个Process组件的实例,例如: Process myProcess new Process(); (2) 设置其对应的StartInfo属性,指定要运行的应用程序名…
在Windows/Ubuntu上使用Visual Studio Code作为Go语言编辑器操作步骤
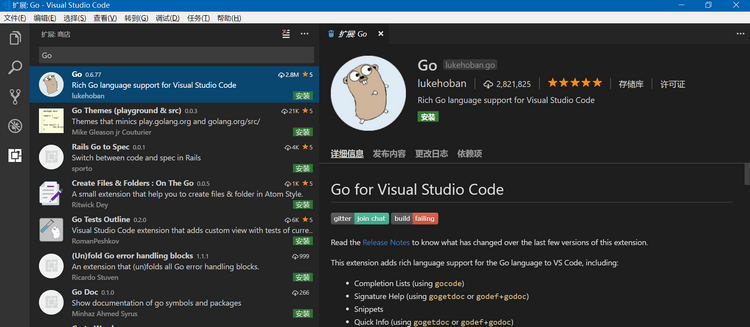
下面以在Windows10上操作为例,在Ubuntu上操作步骤与windows一致: 1. 从 https://code.visualstudio.com/ 下载windows上的最新发布版本1.21.1,即VSCodeSetup-x64-1.21.1.exe; 2. 以管理员身份运行VSCodeSetup-x64-1.21.1.exe&…
实战:基于tensorflow 的中文语音识别模型 | CSDN博文精选
作者 | Pelhans来源 | CSDN博客目前网上关于tensorflow 的中文语音识别实现较少,而且结构功能较为简单。而百度在PaddlePaddle上的 Deepspeech2 实现功能却很强大,因此就做了一次大自然的搬运工把框架转为tensorflow….简介百度开源的基于PaddlePaddle的…
js获取Html元素的实际宽度高度
第一种情况就是宽高都写在样式表里,就比如#div1{width:120px;}。这中情况通过#div1.style.width拿不到宽度,而通过#div1.offsetWidth才可以获取到宽度。第二种情况就是宽和高是写在行内中,比如style"width:120px;",这中…

新框架ES-MAML:基于进化策略、简易的元学习方法
作者 | Xingyou Song、Wenbo Gao、Yuxiang Yang、Krzysztof Choromanski、Aldo Pacchiano、Yunhao Tang译者 | TroyChang编辑 | Jane出品 | AI科技大本营(ID:rgznai100)【导读】现有的MAML算法都是基于策略梯度的,在试图利用随机策…

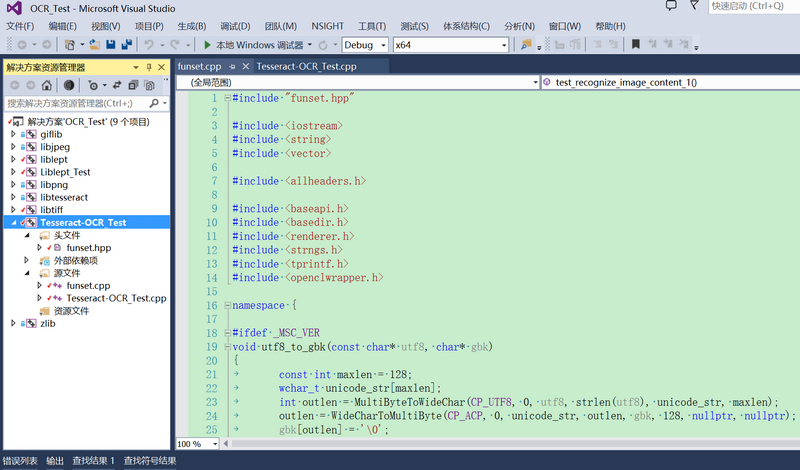
Tesseract-OCR 3.04简单使用举例(读入图像输出识别结果)
下面code是对Tesseract-OCR 3.04版本进行简单使用的举例:包括两段,一个是读入带有中文字符的图像,一个是读入仅有英文字符的图像: #include "funset.hpp"#include <iostream> #include <string> #include &…
坑爹的微软官方文档:SQL无人值守安装
我在部署项目的时候,需要用批处理无人值守安装SQLserver,.Net等组件。 于是查了微软官方文档,其中一项内容如下: http://msdn.microsoft.com/zh-cn/library/ms144259.aspx SQL Server 安装程序控件 /IACCEPTSQLSERVERLICEN…

各种 django 静态文件的配置总结【待续】
2019独角兽企业重金招聘Python工程师标准>>> 最近在学习django框架的使用,想引用静态css文件,怎么都引用不到,从网搜了好多,大多因为版本问题,和我现在的使用的dango1.1配置不同,根据资料和公司…

实战:人脸识别的Arcface实现 | CSDN博文精选
来源 | CSDN博客本文将简单讲述arcface从训练到部署的整个过程,主要包括前期的数据筛选和准备,模型训练以及模型部署。此文参考的arcface的代码地址:https://github.com/ronghuaiyang/arcface-pytorch数据集准备1. 首先准备需要训练的人脸数据…
Windows7/10上快速搭建Tesseract-OCR开发环境操作步骤
之前在https://blog.csdn.net/fengbingchun/article/details/51628957 中描述过如何在Windows上搭建Tesseract-OCR开发环境,那时除了需要clone https://github.com/fengbingchun/OCR_Test 工程外,还需要依赖 https://github.com/fengbingchun/Liblept_T…
C#基础系列:实现自己的ORM(反射以及Attribute在ORM中的应用)
反射以及Attribute在ORM中的应用 一、 反射什么是反射?简单点吧,反射就是在运行时动态获取对象信息的方法,比如运行时知道对象有哪些属性,方法,委托等等等等。反射有什么用呢?反射不但让你在运行是获取对象…
Network | sk_buff
sk_buff结构可能是linux网络代码中最重要的数据结构,它表示接收或发送数据包的包头信息。它在中定义,并包含很多成员变量供网络代码中的各子系统使用。 这个结构被不同的网络层(MAC或者其他二层链路协议,三层的IP,四…

吴恩达老师深度学习视频课笔记:深度学习的实用层面
训练、验证和测试数据集(training、development and test sets):训练神经网络时,我们需要作出很多决策,如神经网络分多少层(layers)、每层含有多少个隐藏层单元(hidden units)、学习率(learning rates)、各层采用哪些激活函数(activation fun…

FtpCopy数据定时自动备份软件(FTP定时备份)
1. 软件说明 FtpCopy是一款免费的FTP数据自动备份软件,如果FtpCopy对您有较大的帮助,欢迎捐赠我们,我们对您表示衷心的感谢! 如果有需求的话会一直更新下去,将软件做到极致! 有问题可直接“反馈留言”。 特…
专注NLP,竹间智能完成4500万美元B+轮融资
近日,竹间智能在成立四周年之际宣布完成4500万美元B轮融资。本轮由某重要战略合作方、云晖资本及领沨资本联合领投,凯思博投资、众安资本、趋势资本、普华资本、一路资本跟投,光源资本担任本轮融资的独家财务顾问。竹间智能方面表示ÿ…
JDBC连接各种数据库方法
为什么80%的码农都做不了架构师?>>> 声明 以下内容收集自网络,并没有亲自测试可用性。 一、Oracle8/8i/9i数据库(thin模式) Class.forName("oracle.jdbc.driver.OracleDriver").newInstance(); String url&…

OpenCV支持中文字符输出实现
在 http://www.opencv.org.cn/forum.php?modviewthread&tid2083&extra&page1 中,作者给出了原始的在OpenCV中 支持中文字符的输入,原始的实现使用的是OpenCV的C接口,使用起来不怎么方便,这里对原作者的实现进行调整&…

CSDN”原力计划“在召唤:技术人请集结,用原创技术影响万千开发者
技术深不可测、薪资难以想象、着装招人吐槽、发量让人惊叹、笑点着实密集、情商令人堪忧......在这个你我他她它通过网络紧密互联、消息实时互通的 21 世纪,人们对身处技术至高点的程序员们仍然有着以上不接地气、呆板保守的误解,对此,操着一…
.asmx支持post请求或者get请求调用(WebService 因 URL 意外地以 结束,请求格式无法识别 的解决方法)...
使用Post调用以asmx形式提供的webservice时,在本机调试没有调用问题。一旦部署至服务器后会提示如下信息: <html><head><title>因 URL 意外地以“/GetCertByToken”结束,请求格式无法识别。</title><meta name&qu…
关于StartCoroutine的简单线程使用
StartCoroutine在unity3d的帮助中叫做协程,意思就是启动一个辅助的线程。 在C#中直接有Thread这个线程,但是在unity中有些元素是不能操作的。这个时候可以使用协程来完成。 使用线程的好处就是不会出现界面卡死的情况,如果有一次非常大量的运…
Robot Framework(十八) 支持工具
5支持工具 5.1库文档工具(libdoc) libdoc是一种用于为HTML和XML格式的测试库和资源文件生成关键字文档的工具。前一种格式适用于人类,后者适用于RIDE和其他工具。Libdoc也没有很少的特殊命令来显示控制台上的库或资源信息。 可以创建文档&…

基于开源TiRG的文本检测与提取实现
在 http://funkybee.narod.ru/ 中作者给出了文本检测和提取的实现,仅有一个.hpp文件,为了在windows上编译通过,这里简单进行了改动,改动后的code如下: #include <math.h> #include <stdio.h> #include &l…