csv文件示例_如何在R中使用数据框和CSV文件-带有示例的详细介绍
csv文件示例
Welcome! If you want to start diving into data science and statistics, then data frames, CSV files, and R will be essential tools for you. Let's see how you can use their amazing capabilities.
欢迎! 如果您想开始研究数据科学和统计学,那么数据框,CSV文件和R将是您必不可少的工具。 让我们看看如何使用它们的惊人功能。
In this article, you will learn:
在本文中,您将学习:
- What CSV files are and what they are used for.什么是CSV文件以及它们的用途。
- How to create CSV files using Google Sheets.如何使用Google表格创建CSV文件。
- How to read CSV files in R.如何在R中读取CSV文件。
- What Data Frames are and what they are used for.什么是数据帧以及它们的用途。
- How to access the elements of a data frame.如何访问数据框的元素。
- How to modify a data frame.如何修改数据框。
- How to add and delete rows and columns.如何添加和删除行和列。
We will use RStudio, an open-source IDE (Integrated Development Environment) to run the examples.
我们将使用RStudio(开放源代码IDE(集成开发环境))运行示例。
Let's begin! 🔅
让我们开始! 🔅
CSV文件简介 (🔹 Introduction to CSV Files)
CSV (Comma-separated Values) files can be considered one of the building blocks of data analysis because they are used to store data represented in the form of a table. In this file, values are separated by commas to represent the different columns of the table, like in this example:
CSV(逗号分隔值)文件可被视为数据分析的基础模块之一,因为它们用于存储以表格形式表示的数据。 在此文件中,值用逗号分隔以代表表的不同列,如以下示例所示:
We will generate this file using Google Sheets.
我们将使用Google表格生成此文件。
🔸如何使用Google表格创建CSV文件 (🔸 How to Create a CSV File Using Google Sheets)
Let's create your first CSV file using Google Sheets.
让我们使用Google表格创建第一个CSV文件。
Step 1: Go to the Google Sheets Website and click on "Go to Google Sheets":
第1步:转到Google表格网站 ,然后点击“转到Google表格”:
💡 Tip: You can access Google Sheets by clicking on the button located at the top-right edge of Google's Home Page:
💡提示:您可以通过单击Google主页右上角的按钮来访问Google表格:
If we zoom in, we see the "Sheets" button:
如果放大,则会看到“表格”按钮:
💡 Tip: To use Google Sheets, you need to have a Gmail account. Alternatively, you can create a CSV file using MS Excel or another spreadsheet editor.
💡 提示:要使用Google表格,您需要拥有一个Gmail帐户。 或者,您可以使用MS Excel或其他电子表格编辑器创建CSV文件。
You will see this panel:
您将看到此面板:
Step 2: Create a blank spreadsheet by clicking on the "+" button.
步骤2:通过点击“ +”按钮创建一个空白电子表格。
Now you have a new empty spreadsheet:
现在您有了一个新的空电子表格:
Step 3: Change the name of the spreadsheet to students_data. We will need to use the name of the file to work with data frames. Write the new name and click enter to confirm the change.
步骤3:将电子表格的名称更改为students_data 。 我们将需要使用文件名来处理数据帧。 输入新名称,然后单击Enter确认更改。
Step 4: In the first row of the spreadsheet, write the titles of the columns.
步骤4:在电子表格的第一行中,编写各列的标题。
When you import a CSV file in R, the titles of the columns are called variables. We will define six variables: first_name, last_name, age, num_siblings, num_pets, and eye_color, as you can see right here below:
在R中导入CSV文件时,列的标题称为变量 。 我们将定义六个变量: first_name , last_name , age , num_siblings , num_pets和eye_color ,如下所示:
💡 Tip: Notice that the names are written in lowercase and words are separated with an underscore. This is not mandatory, but since you will need to access these names in R, it's very common to use this format.
💡 提示:请注意,名称以小写字母书写,单词之间用下划线分隔。 这不是强制性的,但是由于您将需要在R中访问这些名称,因此使用这种格式非常普遍。
Step 5: Enter the data for each one of the columns.
步骤5:为每一列输入数据。
When you read the file in R, each row is called an observation, and it corresponds to data taken from an individual, animal, object, or entity that we collected data from.
当您在R中读取文件时,每一行都称为观察值 ,它对应于从我们收集数据的个人,动物,物体或实体获取的数据。
In this case, each row corresponds to the data of a student:
在这种情况下,每一行对应于一个学生的数据:
Step 6: Download the CSV file by clicking on File -> Download -> Comma-separated values, as you can see below:
步骤6:点击File -> Download -> Comma-separated values下载CSV文件,如下所示:
Step 7: Rename the file CSV file. You will need to remove "Sheet1" from the default name because Google Sheet will automatically add this to the name of the file.
步骤7:重命名CSV文件。 您需要从默认名称中删除“ Sheet1”,因为Google表格会自动将其添加到文件名中。
Great work! Now you have your CSV file and it's time to start working with it in R.
做得好! 现在您有了CSV文件,是时候开始在R中使用它了。
🔹如何在R中读取CSV文件 (🔹 How to Read a CSV file in R)
In RStudio, the first step before reading a CSV file is making sure that your current working directory is the directory where the CSV file is located.
在RStudio中,读取CSV文件之前的第一步是确保当前工作目录是CSV文件所在的目录。
💡 Tip: If this is not the case, you will need to use the full path to the file.
💡 提示:如果不是这种情况,则需要使用文件的完整路径。
更改当前工作目录 (Change Current Working Directory)
You can change your current working directory in this panel:
您可以在此面板中更改当前的工作目录:
If we zoom in, you can see the current path (1) and select the new one by clicking on the ellipsis (...) button to the right (2):
如果我们放大,则可以看到当前路径(1),然后通过单击右侧的省略号( ... )按钮(2)选择新路径:
💡 Tip: You can also check your current working directory with getwd() in the interactive console.
提示:您还可以在交互式控制台中使用getwd()检查当前的工作目录。
Then, click "More" and "Set As Working Directory".
然后,单击“更多”和“设置为工作目录”。
读取CSV文件 (Read the CSV File)
Once you have your current working directory set up, you can read the CSV file with this command:
设置好当前工作目录后,您可以使用以下命令读取CSV文件:
In R code, we have this:
在R代码中,我们有:
> students_data <- read.csv("students_data.csv")💡 Tip: We assign it to the variable students_data to access the data of the CSV file with this variable. In R, we can separate words using dots ., underscores _, UpperCamelCase, or lowerCamelCase.
提示:我们将其分配给变量students_data以使用此变量访问CSV文件的数据。 在R中,我们可以使用点分隔单词. ,下划线_ , UpperCamelCase或lowerCamelCase 。
After running this command, you will see this in the top right panel:
运行此命令后,您将在右上方面板中看到以下内容:
Now you have a variable defined in the environment! Let's see what data frames are and how they are closely related to CSV files.
现在,您在环境中定义了一个变量! 让我们看看什么是数据帧,以及它们与CSV文件如何紧密相关。
Data数据框简介 (🔸 Introduction to Data Frames)
Data frames are the standard digital format used to store statistical data in the form of a table. When you read a CSV file in R, a data frame is generated.
数据框是用于以表格形式存储统计数据的标准数字格式。 在R中读取CSV文件时,将生成一个数据帧 。
We can confirm this by checking the type of the variable with the class function:
我们可以通过使用class函数检查变量的类型来确认这一点:
> class(students_data)
[1] "data.frame"
It makes sense, right? CSV files contain data represented in the form of a table and data frames represent that tabular data in your code, so they are deeply connected.
有道理吧? CSV文件包含以表格形式表示的数据,而数据框架则表示代码中的表格数据,因此它们之间有着密切的联系。
If you enter this variable in the interactive console, you will see the content of the CSV file:
如果在交互式控制台中输入此变量,则将看到CSV文件的内容:
> students_datafirst_name last_name age num_siblings num_pets eye_color
1      Emily    Dawson  15            2        5      BLUE
2       Rose Patterson  14            5        0     GREEN
3  Alexander     Smith  16            0        2     BROWN
4       Nora    Navona  16            4       10     GREEN
5       Gino      Sand  17            3        8      BLUE
有关数据框的更多信息 (More Information About the Data Frame)
You have several different alternatives to see the number of variables and observations of the data frame:
您有几种不同的选择来查看变量数量和对数据框的观察:
- Your first option is to look at the top right panel that shows the variables that are currently defined in the environment. This data frame has 5 observations (rows) and 6 variables (columns):您的第一个选择是查看右上方的面板,该面板显示了环境中当前定义的变量。 该数据框包含5个观察值(行)和6个变量(列):
Another alternative is to use the functions
nrowandncolin the interactive console or in your program, passing the data frame as argument. We get the same results: 5 rows and 6 columns.另一种选择是在交互式控制台或程序中使用
nrow和nrowncol,将数据帧作为参数传递。 我们得到相同的结果:5行和6列。
> nrow(students_data)
[1] 5
> ncol(students_data)
[1] 6
You can also see more information about the data frame using the
strfunction:您还可以使用
str函数查看有关数据框的更多信息:
> str(students_data)
'data.frame':	5 obs. of  6 variables:$ first_name  : Factor w/ 5 levels "Alexander","Emily",..: 2 5 1 4 3$ last_name   : Factor w/ 5 levels "Dawson","Navona",..: 1 3 5 2 4$ age         : int  15 14 16 16 17$ num_siblings: int  2 5 0 4 3$ num_pets    : int  5 0 2 10 8$ eye_color   : Factor w/ 3 levels "BLUE","BROWN",..: 1 3 2 3 1
This function (applied to a data frame) tells you:
此函数(应用于数据框)告诉您:
- The number of observations (rows).观察数(行)。
- The number of variables (columns).变量(列)的数量。
- The names of the variables.变量的名称。
- The data types of the variables.变量的数据类型。
- More information about the variables.有关变量的更多信息。
You can see that this function is really great when you want to know more about the data that you are working with.
当您想了解有关正在使用的数据的更多信息时,可以看到此功能非常有用。
💡 Tip: In R, a "Factor" is a qualitative variable, which is a variable whose values represent categories. For example, eye_color has the values "BLUE", "BROWN", "GREEN" which are categories, so as you can see in the output of str above, this variable is automatically defined as a "factor" when the CSV file is read in R.
提示:在R中,“因子”是定性变量,该变量的值表示类别。 例如, eye_color具有eye_color的值"BLUE" , "BROWN" , "GREEN" ,因此如您在上面的str的输出中看到的那样,当读取CSV文件时,此变量将自动定义为“因素”。在R中
🔹数据框:关键操作和功能 (🔹 Data Frames: Key Operations and Functions)
Now you know how to see more information about the data frame. But the magic of data frames lies in the amazing capabilities and functionality that they offer, so let's see this in more detail.
现在,您知道如何查看有关数据框的更多信息。 但是数据框的魔力在于它们提供的惊人功能,因此让我们更详细地了解这一点。
如何访问数据框的值 (How to Access A Value of a Data Frame)
Data frames are like matrices, so you can access individual values using two indices surrounded by square brackets and separated by a comma to indicate which rows and which columns you would like to include in the result, like this:
数据框就像矩阵一样,因此您可以使用两个用方括号括起来并用逗号分隔的索引来访问各个值,以指示要在结果中包括哪些行和哪些列,如下所示:
For example, if we want to access the value of eye_color (column 6) of the fourth student in the data (row 4):
例如,如果我们要访问数据(第4行)中第四个学生的eye_color (第6列)的值:
We need to use this command:
我们需要使用以下命令:
> students_data[4, 6]💡 Tip: In R, indices start at 1 and the first row with the names of the variables is not counted.
💡 提示:在R中,索引从1开始,并且不计算具有变量名称的第一行。
This is the output:
这是输出:
[1] GREEN
Levels: BLUE BROWN GREEN
You can see that the value is "GREEN". Variables of type "factor" have "levels" that represent the different categories or values that they can take. This output tells us the levels of the variable eye_color.
您可以看到该值为"GREEN" 。 类型为“ factor”的变量具有“级别”,这些级别代表它们可以采用的不同类别或值。 此输出告诉我们变量eye_color的级别。
如何访问数据框的行和列 (How to Access Rows and Columns of a Data Frame)
We can also use this syntax to access a range of rows and columns to get a portion of the original matrix, like this:
我们还可以使用此语法访问一定范围的行和列,以获取原始矩阵的一部分,如下所示:
For example, if we want to get the age and number of siblings of the third, fourth, and fifth student in the list, we would use:
例如,如果我们要获取列表中第三,第四和第五名学生的年龄和兄弟姐妹的数量,则可以使用:
> students_data[3:5, 3:4]age num_siblings
3  16            0
4  16            4
5  17            3
💡 Tip: The basic syntax to define an interval in R is <start>:<end>. Note that these indices are inclusive, so the third and fifth elements are included in the example above when we write 3:5.
提示:在R中定义间隔的基本语法是<start>:<end> 。 请注意,这些索引是包含在内的,因此当我们编写3:5时,上面的示例中包含了第三和第五个元素。
If we want to get all the rows or columns, we simply omit the interval and include the comma, like this:
如果要获取所有行或列,则只需省略间隔并包含逗号,如下所示:
> students_data[3:5,]first_name last_name age num_siblings num_pets eye_color
3  Alexander     Smith  16            0        2     BROWN
4       Nora    Navona  16            4       10     GREEN
5       Gino      Sand  17            3        8      BLUE
We did not include an interval for the columns after the comma in students_data[3:5,], so we get all the columns of the data frame for the three rows that we specified.
我们没有在students_data[3:5,]的逗号后面的列中包含间隔,因此我们获得了指定的三行数据框的所有列。
Similarly, we can get all the rows for a specific range of columns if we omit the rows:
类似地,如果我们省略行,则可以获取特定范围列的所有行:
> students_data[, 1:3]first_name last_name age
1      Emily    Dawson  15
2       Rose Patterson  14
3  Alexander     Smith  16
4       Nora    Navona  16
5       Gino      Sand  17
💡 Tip: Notice that you still need to include the comma in both cases.
💡提示:请注意,在两种情况下,您仍然都需要包含逗号。
如何访问列 (How to Access a Column)
There are three ways to access an entire column:
有三种访问整个列的方法:
Option #1: to access a column and return it as a data frame, you can use this syntax:
选项#1:要访问列并将其作为数据帧返回,可以使用以下语法:
For example:
例如:
> students_data["first_name"]first_name
1      Emily
2       Rose
3  Alexander
4       Nora
5       Gino
Option #2: to get a column as a vector (sequence), you can use this syntax:
选项2:要获取列作为向量(序列),可以使用以下语法:
💡 Tip: Notice the use of the $ symbol.
💡提示:注意$符号的使用。
For example:
例如:
> students_data$first_name[1] Emily     Rose      Alexander Nora      Gino
Levels: Alexander Emily Gino Nora Rose
Option #3: You can also use this syntax to get the column as a vector (see below). This is equivalent to the previous syntax:
选项#3:您还可以使用此语法将列作为向量(请参见下文)。 这等效于先前的语法:
> students_data[["first_name"]][1] Emily     Rose      Alexander Nora      Gino
Levels: Alexander Emily Gino Nora Rose
如何过滤数据框的行 (How to Filter Rows of a Data Frame)
You can filter the rows of a data frame to get a portion of the matrix that meets certain conditions.
您可以过滤数据帧的行以获取满足某些条件的矩阵的一部分。
For this, we use this syntax, passing the condition as the first element within square brackets, then a comma, and finally leaving the second element empty.
为此,我们使用此语法,将条件作为第一个元素放在方括号内,然后传递逗号,最后将第二个元素留空。
For example, to get all rows for which students_data$age > 16, we would use:
例如,要获取所有students_data$age > 16 ,我们将使用:
> students_data[students_data$age > 16,]first_name last_name age num_siblings num_pets eye_color
5       Gino      Sand  17            3        8      BLUE
We get a data frame with the rows that meet this condition.
我们得到一个数据框,其中包含满足此条件的行。
筛选行并选择列 (Filter Rows and Choose Columns)
You can combine this condition with a range of columns:
您可以将此条件与一系列列组合:
> students_data[students_data$age > 16, 3:6]age num_siblings num_pets eye_color
5  17            3        8      BLUE
We get the rows that meet the condition and the columns in the range 3:6.
我们得到满足条件的行,列的范围为3:6 。
🔸如何修改数据框 (🔸 How to Modify Data Frames)
You can modify individual values of a data frame, add columns, add rows, and remove them. Let's see how you can do this!
您可以修改数据框的各个值,添加列,添加行并删除它们。 让我们看看如何做到这一点!
如何改变价值 (How to Change A Value)
To change an individual value of the data frame, you need to use this syntax:
要更改数据框的单个值,您需要使用以下语法:
For example, if we want to change the value that is currently at row 4 and column 6, denoted in blue right here:
例如,如果我们要更改当前在第4行和第6列的值,在此处用蓝色表示:
We need to use this line of code:
我们需要使用以下代码行:
students_data[4, 6] <- "BROWN"💡 Tip: You can also use = as the assignment operator.
💡 提示:您也可以将=用作赋值运算符。
This is the output. The value was changed successfully.
这是输出。 该值已成功更改。
💡 Tip: Remember that the first row of the CSV file is not counted as the first row because it has the names of the variables.
💡提示:请记住,CSV文件的第一行不包含在变量的名称中,因此不算作第一行。
如何将行添加到数据框 (How to Add Rows to a Data Frame)
To add a row to a data frame, you need to use the rbind function:
要将行添加到数据框,您需要使用rbind函数:
This function takes two arguments:
该函数有两个参数:
- The data frame that you want to modify.您要修改的数据框。
A list with the data of the new row. To create the list, you can use the
list()function with each value separated by a comma.具有新行数据的列表。 若要创建列表,可以使用
list()函数,每个值之间用逗号分隔。
This is an example:
这是一个例子:
> rbind(students_data, list("William", "Smith", 14, 7, 3, "BROWN"))The output is:
输出为:
first_name last_name age num_siblings num_pets eye_color
1      Emily    Dawson  15            2        5      BLUE
2       Rose Patterson  14            5        0     GREEN
3  Alexander     Smith  16            0        2     BROWN
4       Nora    Navona  16            4       10     BROWN
5       Gino      Sand  17            3        8      BLUE
6       <NA>     Smith  14            7        3     BROWN
But wait! A warning message was displayed:
可是等等! 显示一条警告消息:
Warning message:
In `[<-.factor`(`*tmp*`, ri, value = "William") :invalid factor level, NA generated
And notice the first value of the sixth row, it is <NA>:
并注意第六行的第一个值是<NA> :
6 <NA> Smith 14 7 3 BROWNThis occurred because the variable first_name was defined automatically as a factor when we read the CSV file and factors have fixed "categories" (levels).
发生这种情况的原因是,当我们读取CSV文件时,变量first_name被自动定义为一个因素,并且因素具有固定的“类别”(级别)。
You cannot add a new level (value - "William") to this variable unless you read the CSV file with the value FALSE for the parameter stringsAsFactors, as shown below:
除非读取参数stringsAsFactors的值为FALSE的CSV文件,否则不能向该变量添加新级别(值- "William" ),如下所示:
> students_data <- read.csv("students_data.csv", stringsAsFactors = FALSE)Now, if we try to add this row, the data frame is modified successfully.
现在,如果我们尝试添加此行,则数据框已成功修改。
> students_data <- rbind(students_data, list("William", "Smith", 14, 7, 3, "BROWN"))
> students_datafirst_name last_name age num_siblings num_pets eye_color
1      Emily    Dawson  15            2        5      BLUE
2       Rose Patterson  14            5        0     GREEN
3  Alexander     Smith  16            0        2     BROWN
4       Nora    Navona  16            4       10     GREEN
5       Gino      Sand  17            3        8      BLUE
6    William     Smith  14            7        3     BROWN
💡 Tip: Note that if you read the CSV file again and assign it to the same variable, all the changes made previously will be removed and you will see the original data frame. You need to add this argument to the first line of code that reads the CSV file and then make changes to it.
💡提示:请注意,如果再次读取CSV文件并将其分配给同一变量,则先前所做的所有更改都将被删除,您将看到原始数据框。 您需要将此参数添加到读取CSV文件的第一行代码,然后对其进行更改。
如何将列添加到数据框 (How to Add Columns to a Data Frame)
Adding columns to a data frame is much simpler. You need to use this syntax:
将列添加到数据框要简单得多。 您需要使用以下语法:
For example:
例如:
> students_data$GPA <- c(4.0, 3.5, 3.2, 3.15, 2.9, 3.0)💡 Tip: The number of elements has to be equal to the number of rows of the data frame.
提示:元素的数量必须等于数据帧的行数。
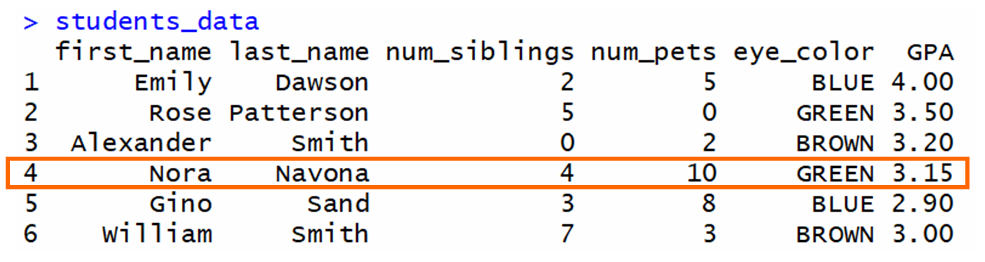
The output shows the data frame with the new GPA column:
输出显示带有新GPA列的数据框:
> students_datafirst_name last_name age num_siblings num_pets eye_color  GPA
1      Emily    Dawson  15            2        5      BLUE 4.00
2       Rose Patterson  14            5        0     GREEN 3.50
3  Alexander     Smith  16            0        2     BROWN 3.20
4       Nora    Navona  16            4       10     GREEN 3.15
5       Gino      Sand  17            3        8      BLUE 2.90
6    William     Smith  14            7        3     BROWN 3.00
如何删除列 (How to Remove Columns)
To remove columns from a data frame, you need to use this syntax:
要从数据框中删除列,您需要使用以下语法:
When you assign the value Null to a column, that column is removed from the data frame automatically.
当您将值Null分配给列时,该列将自动从数据框中删除。
For example, to remove the age column, we use:
例如,要删除age列,我们使用:
> students_data$age <- NULLThe output is:
输出为:
> students_datafirst_name last_name num_siblings num_pets eye_color  GPA
1      Emily    Dawson            2        5      BLUE 4.00
2       Rose Patterson            5        0     GREEN 3.50
3  Alexander     Smith            0        2     BROWN 3.20
4       Nora    Navona            4       10     GREEN 3.15
5       Gino      Sand            3        8      BLUE 2.90
6    William     Smith            7        3     BROWN 3.00
如何删除行 (How to Remove Rows)
To remove rows from a data frame, you can use indices and ranges. For example, to remove the first row of a data frame:
要从数据框中删除行,可以使用索引和范围。 例如,要删除数据帧的第一行:

The [-1,] takes a portion of the data frame that doesn't include the first row. Then, this portion is assigned to the same variable.
[-1,]占据了数据帧中不包含第一行的一部分。 然后,将这部分分配给相同的变量。
If we have this data frame and we want to delete the first row:
如果我们有此数据框,并且要删除第一行:
The output is a data frame that doesn't include the first row:
输出是不包含第一行的数据帧:
In general, to remove a specific row, you need to use this syntax where <row_num> is the row that you want to remove:
通常,要删除特定的行,您需要使用以下语法,其中<row_num>是要删除的行:
💡 Tip: Notice the - sign before the row number.
💡提示:请注意行号前的-号。
For example, if we want to remove row 4 from this data frame:
例如,如果我们要从此数据框中删除第4行:
The output is:
输出为:
As you can see, row 4 was successfully removed.
如您所见,第4行已成功删除。
Summary总结 (🔹 In Summary)
- CSV files are Comma-Separated Values Files used to represent data in the form of a table. These files can be read using R and RStudio.CSV文件是逗号分隔的值文件,用于以表格形式表示数据。 可以使用R和RStudio读取这些文件。
- Data frames are used in R to represent tabular data. When you read a CSV file, a data frame is created to store the data.R中使用数据帧表示表格数据。 读取CSV文件时,将创建一个数据框来存储数据。
- You can access and modify the values, rows, and columns of a data frame.您可以访问和修改数据框的值,行和列。
I really hope that you liked my article and found it helpful. Now you can work with data frames and CSV files in R.
我真的希望您喜欢我的文章并发现它对您有所帮助。 现在,您可以在R中使用数据框和CSV文件。
If you liked this article, consider enrolling in my new online course "Introduction to Statistics in R - A Practical Approach"
如果您喜欢这篇文章,请考虑 注册我的新在线课程 “ R中的统计学简介-一种实用方法 ”
翻译自: https://www.freecodecamp.org/news/how-to-work-with-data-frames-and-csv-files-in-r/
csv文件示例
相关文章:

1小时学会:最简单的iOS直播推流(八)h264/aac 软编码
最简单的iOS 推流代码,视频捕获,软编码(faac,x264),硬编码(aac,h264),美颜,flv编码,rtmp协议,陆续更新代码解析,你想学的知识这里都有…
003小插曲之变量和字符串
变量:赋值(名字值);变量名:字母分大小写/数字/下划线,不能以数字开头;拼接;原始字符串r; 专业优秀的名称:teacher/num/name/test/temp >>> teacher小…
mysql插入大量数据
创建实验表: CREATE TABLE a ( id int(11) NOT NULL AUTO_INCREMENT, name char(50) NOT NULL, type char(20) NOT NULL, PRIMARY KEY (id)) ENGINEInnoDB; 创建存储语句: delimiter // create procedure insertdata() begin declare i int …
十六进制190的2进制数_十六进制数系统解释
十六进制190的2进制数Hexadecimal numbers, often shortened to “hex numbers” or “hex”, are numbers represented in base 16 as opposed to base 10 that we use for everyday arithmetic and counting.十六进制数字(通常缩写为“十六进制数字”或“十六进制”)是以16为…
初学ssm框架的信息
ssm框架,就是Spring ,SpringMVC ,mybstis 的简称,我们是从mybstis 开始学起的,mybatis的作用作为一个连接数据库的框架,可以很好配置连接好数据库, 有mybatis,我们对数据库增删改查的操作更为简便了。SSM框架ÿ…

转:YUV RGB 常见视频格式解析
转: http://www.cnblogs.com/qinjunni/archive/2012/02/23/2364446.html YUV RGB 常见视频格式解析 I420是YUV格式的一种,而YUV有packed format和planar format两种,而I420属于planar format的一种。 同时I420表示了YUV的采样比例4:2:0。4…
1小时学会:最简单的iOS直播推流(十)librtmp使用介绍
最简单的iOS 推流代码,视频捕获,软编码(faac,x264),硬编码(aac,h264),美颜,flv编码,rtmp协议,陆续更新代码解析,你想学的知识这里都有…
导入语句 python_Python导入语句说明
导入语句 pythonWhile learning programming and reading some resources you’d have come across this word ‘abstraction’ which simply means to reduce and reuse the code as much as possible.在学习编程和阅读一些资源时,您会遇到“抽象”一词,…
网页性能测试---webpagetest
http://www.webpagetest.org/转载于:https://www.cnblogs.com/cai-yu-candice/p/8194866.html
1小时学会:最简单的iOS直播推流(十一)spspps和AudioSpecificConfig介绍(完结)
最简单的iOS 推流代码,视频捕获,软编码(faac,x264),硬编码(aac,h264),美颜,flv编码,rtmp协议,陆续更新代码解析,你想学的知识这里都有…
ES5 数组方法forEach
ES6已经到了非学不可的地步了,对于ES5都不太熟的我决定是时候学习ES5了。 1. js 数组循环遍历。 数组循环变量,最先想到的就是 for(var i0;i<count;i)这样的方式了。 除此之外,也可以使用较简便的forEach 方式 2. forEach 函数。 使用如…
pytorch深度学习_了解如何使用PyTorch进行深度学习
pytorch深度学习PyTorch is an open source machine learning library for Python that facilitates building deep learning projects. Weve published a 10-hour course that will take you from being complete beginner in PyTorch to using it to code your own GANs (gen…
LwIP Application Developers Manual12---Configuring lwIP
1.前言 2.LwIP makefiles With minimal featuresC_SOURCES \ src/api/err.c \ src/core/init.c \ src/core/mem.c \ src/core/memp.c \ src/core/netif.c \ src/core/pbuf.c \ src/core/stats.c \ src/core/udp.c \ src/core/ipv4/icmp.c \ src/core/ipv4/inet.c \ src/core/i…

仿斗鱼聊天:基于CoreText的面向对象图文排版工具AWRichText
AWRichText 基于CoreText,面向对象,极简,易用,高效,支持精确点击,UIView混排,GIF动图,并不仅仅局限于图文混排的富文本排版神器。 代码地址:https://github.com/hardman/…
搭建nexus后,进入首页的时候出现warning: Could not connect to Nexus.错误
nexus出现这种问题,一般是版本太旧,换一个高版本的nexus就能解决了。 转载于:https://www.cnblogs.com/tietazhan/p/5459393.html
微软hackathon_武汉Hackathon的黑客之路–开发人员如何抗击COVID-19
微软hackathonThe Chinese New Year in 2020 was one of the saddest Chinese New Years in recent memory. After the sudden outbreak of the COVID-19 virus, the city pressed pause on all celebrations.2020年的农历新年是最近记忆中最可悲的农历新年之一。 在COVID-19病…

SVN版本控制系统使用
一.版本控制系统安装: 软件下载地址:https://www.visualsvn.com/downloads/ 二.安装版本控制系统以后,在window下,设置环境变量。 三.在命令提示符控制台查看服务器版本:svn --version 四.创建仓库:F:\DevR…
iOS的KVO实现剖析
KVO原理 对于KVO的原理,很多人都比较清楚了。大概是这样子的: 假定我们自己的类是Object和它的对象 obj, 当obj发送addObserverForKeypath:keypath消息后,系统会做3件事情: 动态创建一个Object的子类,名…
你真的以为了解java.io吗 呕心沥血 绝对干货 别把我移出首页了
文章结构1 flush的使用场景2 一个java字节流,inputstream 和 outputstream的简单例子3 分别测试了可能抛出java.io.FileNotFoundException,java.io.FileNotFoundException: test (拒绝访问。),java.io.FileNotFoundException: test.txt (系统…
GitHub为所有人免费提供了所有核心功能-这就是您应该关心的原因
Just a couple of days ago, GitHub wrote a blog article stating that it is now free for teams. Heres the official blog article if youre interested. 就在几天前,GitHub写了一篇博客文章,指出它现在对团队免费。 如果您有兴趣,这是官…
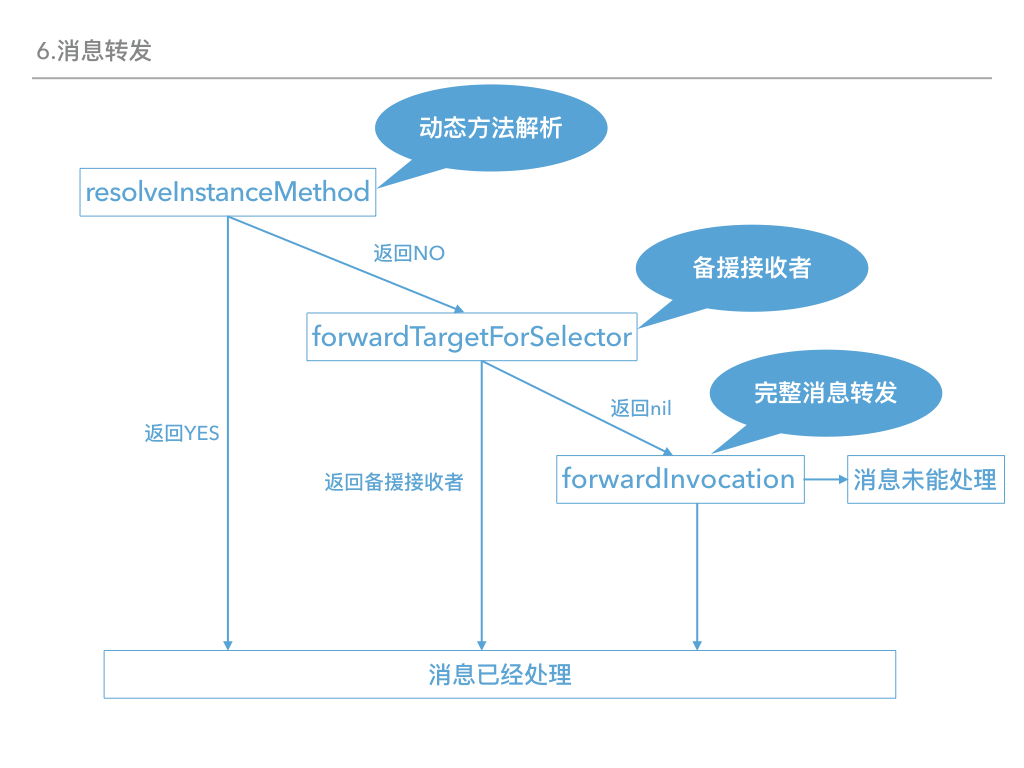
什么是ObjCTypes?
先看一下消息转发流程: 在forwardInvocation这一步,你必须要实现一个方法: - (NSMethodSignature *)methodSignatureForSelector:(SEL)aSelector OBJC_SWIFT_UNAVAILABLE(""); 该方法用于说明消息的返回值和参数类型。NSMethodSignature是方法签名&#x…
0基础JavaScript入门教程(一)认识代码
1. 环境: JavaScript简称js,后续我们将使用js来代替JavaScript。 认识代码前,需要安装js代码运行环境。 安装nodejs:在https://nodejs.org/zh-cn/ 下载LTS版本,然后安装安装visual studio code:https://…

junit、hamcrest、eclemma的安装与使用
1、junit的安装与使用 1.1 安装步骤 1)从http://www.junit.org/ 下载junit相应的jar包; 2) 在CLASSPATH中加入JAR包所在的路径,如E:\Java\jar\junit\junit-4.10.jar; 3) 将junit-4.10.jar加入到项目的lib文…
如何撰写将赢得客户青睐的自由职业者提案和免费模板
Your prospective client asks you to provide them with a quote. So you just send them the quote, right?您的潜在客户要求您提供报价。 所以您只给他们发送报价吧? Wrong.错误。 If you did, you would be missing out on a massive opportunity here.如果这…

2. 把一幅图像进行平移。
实验二 #include "cv.h" #include<stdio.h> #include "highgui.h" IplImage *PingYi(IplImage *src, int h0, int w0); int main(int argc, char** argv) {IplImage* pImg; //声明IplImage指针IplImage* pImgAfterMove;pImg cvLoadImage("601…
后台的代理nginx部署方法
软件包如下:nginx-1.10.0.tar.gznginx-http-concat-master.zipngx_cache_purge-2.3.tar.gzopenssl-1.0.2h.tar.gzpcre-8.39.tar.gzzlib-1.2.8.tar.gz ngin部署方法:上面的安装包都存放在/apps/svr/soft目录下:cd /apps/svr/softtar -zxf nginx-1.10.0.ta…
iOS中你可能没有完全弄清楚的(一)synthesize
1. 什么是synthesize synthesize中文意思是合成,代码中我们经常这样用。 interface Test: NSObject property (nonatomic, unsafe_unretained) int i; endimplementation Test synthesize i; end 复制代码 使用synthesize的2个步骤: 首先你要有在类声…

framer x使用教程_如何使用Framer Motion将交互式动画和页面过渡添加到Next.js Web应用程序
framer x使用教程The web is vast and its full of static websites and apps. But just because those apps are static, it doesnt mean they have to be boring. 网络非常庞大,到处都是静态的网站和应用。 但是,仅仅因为这些应用程序是静态的…

POJ 2429
思路:a/n*b/nlcm/gcd 所以这道题就是分解ans.dfs枚举每种素数情况。套Miller_Rabin和pollard_rho模板 1 //#pragma comment(linker, "/STACK:167772160")//手动扩栈~~~~hdu 用c交2 #include<cstdio>3 #include<cstring>4 #include<cstdlib…

iOS中你可能没有完全弄清楚的(二)自己实现一个KVO源码及解析
前几天写了一篇blog(点这里),分析了系统KVO可能的实现方式。并添加了简单代码验证。 既然系统KVO不好用,我们完全可以根据之前的思路,再造一个可以在项目中使用的KVO的轮子。 代码已经上传到github: https://github.…