构造决策树时需要解决的第一个问题是:当前数据集中哪个特征在划分数据分类时起决定性作用。
划分数据集的原则:将无序的数据变得更加有序
信息增益:在划分数据集前后信息发生的变化
获得信息增益最大的特征就是最好的特征
熵:信息的期望值,表示信息的混乱程序,越混乱熵越大
信息增益可以表示为信息熵的减小

[https://blog.csdn.net/moxigandashu/article/details/71305273?locationNum=9&fps=1]
以下代码均在trees.py文件内。
计算给定数据集的信息熵:
from math import log
import operator
import treePlotter
def calcShannonEnt(dataset):numEntries=len(dataset)labelCounts={}for featVec in dataset:currentLabel=featVec[-1]if currentLabel not in labelCounts.keys():labelCounts[currentLabel]=0labelCounts[currentLabel]+=1shannonEnt=0.0for key in labelCounts:     #遍历字典,key是字典的键prob=float(labelCounts[key])/numEntriesshannonEnt-=prob*log(prob,2)return shannonEnt
根据给定特征及特征值划分数据集:
def splitDataSet(dataset,index,value):  #按照给定特征划分数据集。index,value两个参数用来确定特征及其特征值retDataset=[]for featVec in dataset:if featVec[index]==value:reducedFeatVec=featVec[:index]#print(reducedFeatVec)reducedFeatVec.extend(featVec[index+1:])#print(reducedFeatVec)retDataset.append(reducedFeatVec)#print(retDataset)return retDataset
def createDataSet():dataSet=[[1,1,'yes'],[1,1,'yes'],[1,0,'no'],[0,1,'no'],[0,1,'no']]features=['no surfacing','flippers']return dataSet,features
选择最好的数据集划分方式,即为确定最恰当的特征:
def chooseBestFeatureToSplit(dataset):numFeatures=len(dataset[0])-1 #确定特征个数baseEntropy=calcShannonEnt(dataset)bestInfoGain=0bestFeature=-1for i in range(numFeatures):featureList=[example[i] for example in dataset] #第i个特征的所有特征值uniqueVals=set(featureList) #将所有特征值去重,得到标称型数值newEntropy=0.0for value in uniqueVals:subDataset=splitDataSet(dataset,i,value)prob=len(subDataset)/float(len(dataset)) #第i个特征值为value的记录个数与数据集总数的比值代表第i个特征值为value的概率newEntropy+=prob*calcShannonEnt(subDataset)infoGain=baseEntropy-newEntropy #信息增益等于熵的减少,或者说是数据无序度的减少if infoGain>bestInfoGain:bestInfoGain=infoGainbestFeature=ireturn bestFeature
标称型数值也叫离散型,表示数值只能在有限的目标集中取得,例如true和false
构建决策树的原理:得到原始数据集,然后基于最好的属性值划分数据集,由于特征值可能多于两个,因此可能存在大于两个分支的数据集划分。第一次划分之后,数据将被向下传递到树分支的下一个节点,在这个节点上,我们可以再次划分数据。因此我们可以采用递归的原则处理数据集。
递归结束的条件是:程序遍历完所有划分数据集的属性,或者每个分支下的所有实例都具有相同的分类。如果所有实例都具有相同的分类,则得到一个叶子节点或者终止块,任何到达叶子节点的数据必然属于叶子节点的分类。
如果数据集已经处理了所有特征,剩下的记录的标签仍然不唯一,这种情况下通常采用多数表决的方法决定改叶子节点的类别:
def majorityCnt(classList): #多数表决,决定叶子节点的分类classCount={}for vote in classList:if vote not in classCount.keys():classCount[vote]=0classCount[vote]+=1sortedClassCount=sorted(classCount.items(),key=operator.itemgetter(1),reverse=True) #第二维降序排列return sortedClassCount[0][0]
递归创建树的函数代码:
def createTree(dataset,featureList): #数据集,特征列表,产生决策树,返回值是字典featureListCopy=featureList[:] #不能改变传递进来的实参featureListclassList=[record[-1] for record in dataset] #标签列表,即为数据集最后一列if classList.count(classList[0])==len(classList): #如果标签列表中第一个值出现的次数等于标签列表长度,就说明标签列表内的元素都相同了return classList[0] #此时形成叶子节点,即为终止块if len(dataset[0])==1: #如果数据集的第一行长度为1,说明决策树进行到使用完所有特征,只剩下标签而且标签不唯一,此时需要调用多数表决来决定此叶子节点的类别return majorityCnt(classList)bestFeat=chooseBestFeatureToSplit(dataset) #选取最佳特征对应的索引bestFeatLabel=featureListCopy[bestFeat] #找到最佳特征myTree={bestFeatLabel:{}} #用字典存储决策树del featureListCopy[bestFeat] #提出最佳特征featValues=[record[bestFeat] for record in dataset] #最佳特征的所有取值uniqueVal=set(featValues) #最佳特征取值形成的集合,去重for value in uniqueVal: #value是最佳特征的值subFeatureList=featureListCopy[:] #剔除最佳特征的特征列表myTree[bestFeatLabel][value]=createTree(splitDataSet(dataset,bestFeat,value),subFeatureList) #splitDataSet(dataset,bestFeat,value)表示划分后的数据集return myTree
使用决策树的分类函数:
def classify(inputTree,featLabels,testVec): #参数分别是:决策树,特征列表,待分类样本firstNode=list(inputTree.keys())[0]secondDict=inputTree[firstNode]featIndex=featLabels.index(firstNode)for key in secondDict.keys():if testVec[featIndex]==key:if type(secondDict[key]).__name__=='dict':classLabel=classify(secondDict[key],featLabels,testVec)else:classLabel=secondDict[key]return classLabel
使用pickle模块存储、获取决策树,避免每次使用决策树时都需要重新生成:
def storeTree(inputTree,filename):import picklefw=open(filename,'wb')  #wb表示以bytes的形式存储pickle.dump(inputTree,fw,)fw.close()
def getTree(filename):import picklefr=open(filename,'rb')  #rb表示以bytes的形式存储return pickle.load(fr)
以下代码均在treePlotter.py文件内:
使用matplotlib库的注解功能绘制树节点:
import matplotlib.pyplot as plt
decisionNode=dict(boxstyle="sawtooth",fc='0.8')
leafNode=dict(boxstyle='round4',fc='0.8')
arrow_args=dict(arrowstyle='<-')def plotNode(nodeTxt,centerPt,parentPt,nodeType):createPlot.picture.annotate(nodeTxt,xy=parentPt,xycoords='axes fraction',xytext=centerPt,textcoords='axes fraction',va='center',ha='center',bbox=nodeType,arrowprops=arrow_args)
获取叶节点数目:
def getNumberOfLeafs(myTree): #计算决策树叶子节点数目numberOfLeafs=0firstNode=list(myTree.keys())[0]secondDict=myTree[firstNode]for key in secondDict.keys():if type(secondDict[key]).__name__ == 'dict':numberOfLeafs+=getNumberOfLeafs(secondDict[key])else:numberOfLeafs+=1return numberOfLeafs
获取决策树层数:
def getTreeDepth(myTree): #计算决策树的层数maxDepth=0firstNode=list(myTree.keys())[0]secondDic=myTree[firstNode]for key in secondDic.keys():if type(secondDic[key]).__name__=='dict':thisDepth=1+getTreeDepth(secondDic[key]) #计算此分支下的深度else:thisDepth=1if thisDepth>maxDepth: #比较每个分支的层数与最大层数,用来更新最大层数。maxDepth=thisDepthreturn maxDepth
plotTree函数:
def plotMidText(sonNode,parentPt,txtString): #将决策树的键值放在连接线的中间位置xMid=(parentPt[0]-sonNode[0])/2.0+sonNode[0]yMid=(parentPt[1]-sonNode[1])/2.0+sonNode[1]createPlot.picture.text(xMid,yMid,txtString)def plotTree(myTree,parentPt,nodeTxt): #画出决策树numLeafs=getNumberOfLeafs(myTree)depth=getTreeDepth(myTree)firstNode=list(myTree.keys())[0]sonNode=(plotTree.xOff+(1.0+float(numLeafs))/2.0/plotTree.totalW,plotTree.yOff)plotMidText(sonNode, parentPt, nodeTxt)plotNode(firstNode, sonNode, parentPt, decisionNode)secondDict = myTree[firstNode]plotTree.yOff = plotTree.yOff - 1.0 / plotTree.totalDfor key in secondDict.keys():if type(secondDict[key]).__name__ == 'dict': # test to see if the nodes are dictonaires, if not they are leaf nodesplotTree(secondDict[key], sonNode, str(key)) # recursionelse:plotTree.xOff = plotTree.xOff + 1.0 / plotTree.totalWplotNode(secondDict[key], (plotTree.xOff, plotTree.yOff), sonNode, leafNode)plotMidText((plotTree.xOff, plotTree.yOff), sonNode, str(key))plotTree.yOff = plotTree.yOff + 1.0 / plotTree.totalDdef createPlot(inTree):fig = plt.figure(1, facecolor='white')fig.clf()axprops = dict(xticks=[], yticks=[])createPlot.picture = plt.subplot(111, frameon=False, **axprops) #在函数内声明全局变量plotTree.totalW = float(getNumberOfLeafs(inTree)) #宽度plotTree.totalD = float(getTreeDepth(inTree)) #高度plotTree.xOff = -0.5 / plotTree.totalWplotTree.yOff = 1.0plotTree(inTree, (0.5, 1.0), '')plt.show()
手动声明两个决策树方便测试:
def retrieveTree(i):listOfTrees=[{'no surfacing':{0:'no',1:{'flippers':{0:'no',1:'yes'}}}},{'no surfacing':{0:'no',1:{'flippers':{0:{'head':{0:'no',1:'yes'}},1:'no'}}}}]return listOfTrees[i]
使用决策树执行具体数据的分类如下(使用决策树.py):
import trees
import treePlotterfr=open('lenses.txt')
lenses=[example.strip().split('\t') for example in fr.readlines()]
lensesLabels=['age','prescript','astigmatic','tearRate']
lensesTree=trees.createTree(lenses,lensesLabels)  #生成决策树,存储为字典
print(lensesTree)  #打印决策树字典
treePlotter.createPlot(lensesTree)  #画出决策树
以上代码会输出决策树字典:
{'tearRate': {'reduced': 'no lenses', 'normal': {'astigamtic': {'no': {'age': {'young': 'soft', 'pre': 'soft', 'presbyopic': {'prescript': {'hyper': 'soft', 'myope': 'no lenses'}}}}, 'yes': {'prescript': {'hyper': {'age': {'young': 'hard', 'pre': 'no lenses', 'presbyopic': 'no lenses'}}, 'myope': 'hard'}}}}}}
画出决策树如下: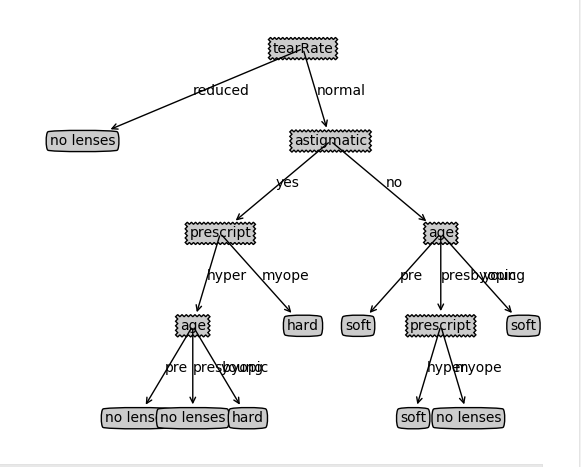
使用此决策树来分类:
result=trees.classify(lensesTree,lensesLabels,['young', 'myope', 'no', 'reduced'])
print(result)
输出:
no lenses