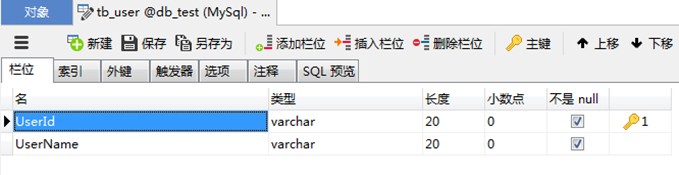
1.显示隐藏工具栏
![]()
注释toolbox即可
/* toolbox: {show : true,feature : {dataView : {show: true, readOnly: false},magicType : {show: true, type: ['line', 'bar']},restore : {show: true},saveAsImage : {show: true}}},*/2.鼠标划过数据显示对应的数据
tooltip : {trigger: 'axis'//设置这个即可 划过显示数据},3.修改不同产品分类(legend)的样式
textStyle: {fontSize: 12,color: '#fff'//显示的字体颜色}4.修改图标的位置
grid: {show: true,left: 35, //组件离容器左侧的距离,百分比字符串或整型数字top: 25, //组件离容器上侧的距离,百分比字符串或整型数字//bottom:40//组件离容器底部的距离,百分比字符串或整型数字}, 5.柱状图中的柱状样式
var labelOption = {normal: {show: true,position: 'top',//数据显示在柱状体的位置align: 'middle',verticalAlign: 'bottom',formatter: '{c}',fontSize: 14,color: '#fff',rotate: 35,//显示数据旋转的角度fontWeight: 'normal',}};使用:series : [{name:'07010011',type:'bar',data:[800, 530, 520, 512, 480],color:'#7BB0E4',label:labelOption},{name:'90612011',type:'bar',data:[180, 460, 9.0, 26.4, 28.7],color:'#404048',label:labelOption},{name:'07810011',type:'bar',data:[2.6, 5.9, 9.0, 26.4, 28.7],color:'#8DEC6E',label:labelOption},]6.修改y坐标的数据信息
1>数据固定在 yAxis 增加max 和min 属性yAxis: {type: 'value',max:1000,min:0,... }
2>数据大小不固定
在 yAxis 的 axisLabel中增加formatter: function formatter(value, index) {//使用函数模板,函数参数分别为刻度数值(类目),刻度的索引if (value >= 250) {value = (value + "").slice(0, -3);return value + "K";} else {return value;}},
来源:https://blog.csdn.net/sinat_32900379/article/details/85157730